South Africa Healthcare (Pharma and Medical Devices) Market Analysis, Regulatory, Reimbursement and Competitive Landscape

Powered by

All the vital news, analysis, and commentary curated by our industry experts.

South Africa Healthcare Market Overview

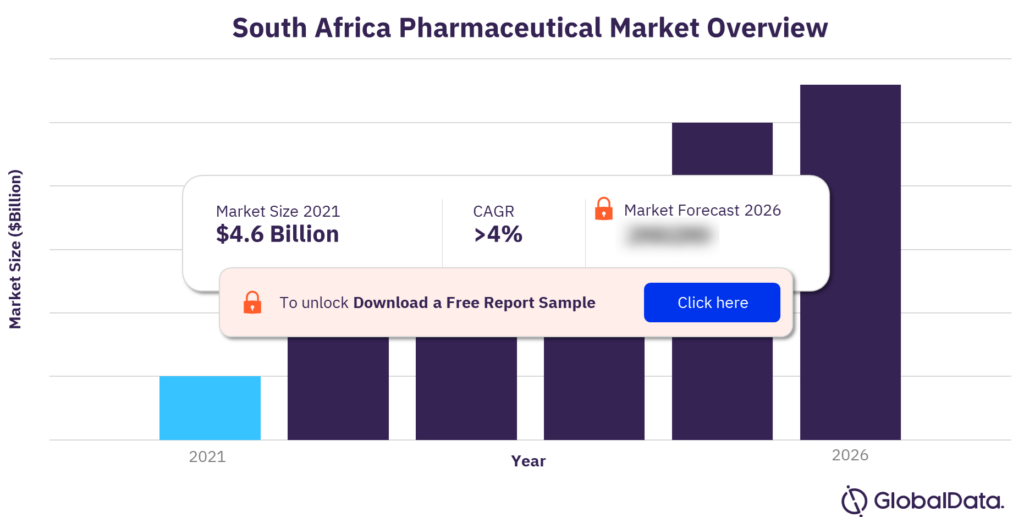
The South Africa pharmaceutical market size was valued at $4.6 billion in 2021. The market is projected to grow at a CAGR of more than 4% during the forecast period (2022-2026). The key factors driving the pharmaceutical market growth in South Africa are the growing and aging population, larger prevalence of chronic diseases, expanding private health insurance coverage, and increased patient volumes for general practitioners and specialist medical practitioners. The pharmaceutical market of the country is extensively reliant on imported products, accounting for more than two-third of pharmaceutical sales.

The South Africa medical devices market size was valued at $3.6 billion in 2021. The market is expected to grow at a CAGR of more than 4% during the forecast period (2022-2027). In South Africa, increased government spending to upgrade public health facilities and systems as part of their NHI implementation program may catalyze some growth in this sector, though recent significant budgetary shortfalls and pandemic fallout might have a negative impact on government spending.

South Africa Healthcare (Pharma) Market Outlook

South Africa Healthcare (Pharma) Market Outlook

For more insights, download a free sample report

South Africa Healthcare (Medical Devices) Market Outlook

South Africa Healthcare (Medical Devices) Market Outlook

For more insights, download a free sample report

What are the market dynamics in the South Africa pharmaceutical market?

In December 2021, South Africa’s Biovac Institute, a bio-pharmaceutical company based in Cape Town, announced plans to manufacture Pfizer-BioNTech’s COVID-19 vaccine for distribution within the African region. As per the agreement between the two, Biovac will perform manufacturing and distribution activities within Pfizer’s and BioNTech’s global COVID-19 vaccine supply chain and manufacturing network. Manufacturing is expected to commence from 2022.

In November 2021, Novelty Technology Care (NTC), an R&D-driven pharmaceutical company headquartered in Italy, and Aspen, headquartered in South Africa, announced SAHPRA’s approval for the first fixed combination of an ophthalmic quinolone antibiotic (levofloxacin) with an anti-inflammatory steroid (dexamethasone) eye drop solution.

What are the key segments in the South Africa pharmaceutical market?

The key segments in the South Africa pharmaceutical market are generics, biologics, biosimilars, and over-the-counter (OTC).

In November 2021, Pfizer signed a licensing agreement allowing generic drug manufacturers to produce inexpensive versions of its COVID-19 pill. South Africa is on the list of 95 countries standing to benefit from the agreement.

Who are the key players in the South Africa pharmaceutical market?

The key players in the South Africa pharmaceutical market are Pfizer, F. Hoffmann-La Roche Ltd. (Roche), Novartis, Sanofi, and Aspen Pharmacare Holdings Ltd (Aspen).

Pfizer

Pfizer is a research-based global biopharmaceutical company that discovers, develops, manufactures, and commercializes drugs for various conditions, consumer healthcare products, generics, and active pharmaceutical ingredients (APIs). Pfizer is headquartered in the US. In South Africa, it operates from Johannesburg.

Hoffmann-La Roche Ltd

Hoffmann-La Roche Ltd. (Roche) is a biotechnology company that develops drugs and diagnostics to treat major diseases including autoimmune diseases, central nervous system disorders, ophthalmological disorders, infectious diseases, and respiratory diseases. The company also offers in vitro diagnostics, tissue-based cancer diagnostics, and diabetes management solutions. Roche is headquartered in Basel, Switzerland; in South Africa, it operates from Midrand.

Novartis

Novartis is a healthcare company that focuses on the discovery, development, manufacture, and marketing of prescription and generic pharmaceutical products, as well as eye care products. It provides drugs for the treatment of cancer and other diseases. Novartis is headquartered in Basel, Switzerland. In South Africa, it operates from Gauteng.

Which are the key segments in the South Africa medical devices market?

The key segments in the South Africa medical devices market are hospital supplies, general energy, orthopedic devices, cardiovascular devices, dental devices, and others. Hospital supplies has the highest revenue in the medical devices market in South Africa in the year 2021.

Who are the key players in the South Africa medical devices market?

The key players in the South Africa medical devices market are Abbott, Medtronic, Kimberly-Clark, GE Healthcare, Getinge AB (Getinge).

Kimberly-Clark

Kimberly-Clark is a global hygiene company, involved in the manufacturing and marketing of personal care and household products. The company operates in North America, Europe, Middle East and Africa, Asia, and Latin America. Kimberly-Clark is headquartered in Irving, Texas, US. The company operates in Johannesburg, South Africa.

Getinge AB (Getinge)

Getinge AB (Getinge) is a medical technology company that designs, develops, and markets equipment and instruments in the areas of surgery, infection control, intensive care, care ergonomics, and wound care. Its major products include heart-lung machines and hospital beds, among others. Getinge is headquartered in Gothenburg, Sweden, and in South Africa, it operates from Sandton.

Medtronic

Medtronic is a medical technology company. It provides a wide range of medical devices for the treatment of heart disease, spinal conditions, neurological disorders, vascular disease, orthopedic disorders, and diabetes. Medtronic is headquartered in Dublin, Ireland. Medtronic’s footprint is in the Central and Eastern Europe, Middle East and Africa (CEMA) region. In South Africa, Medtronic is in Midrand, Gauteng.

Market report overview of pharmaceutical market in South Africa

Market size 2021 $4.6 billion
CAGR >4% (2022-2026)
Forecast period 2022-2026
Key segments Generics, Biologics, Biosimilars, and Over-The-Counter (OTC)
Major players Pfizer, F. Hoffmann-La Roche Ltd. (Roche), Novartis, Sanofi, and Aspen Pharmacare Holdings Ltd (Aspen)

Market report overview of medical devices market in South Africa

Market size 2021 $3.6 billion
CAGR >4% (2022-2027)
Forecast period 2022-2027
Key segments Hospital Supplies, General Energy, Orthopedic Devices, Cardiovascular Devices, Dental Devices, and Others
Major players Abbott, Medtronic, Kimberly-Clark, GE Healthcare, and Getinge AB (Getinge)

Scope

The report provides information on the healthcare, regulatory, and reimbursement landscape in South Africa, and includes:

  • An overview of the pharmaceutical and medical device markets, comprising market size, segmentation, and key drivers and barriers.
  • Profiles and SWOT analyses of the major players in the pharmaceutical market: Pfizer, Roche, Novartis, Sanofi, and Aspen
  • Profiles and SWOT analyses of the major players in the medical device market: Abbott, Medtronic, Kimberly Clark, GE healthcare, and Getinge.
  • An insightful review of the COVID-19 epidemiology, COVID-19 impact and developments in healthcare market, Healthtech landscape, reimbursement and regulatory landscape, with analysis covering details of the country’s healthcare reimbursement process, regulatory agencies and the approval processes for new drugs and medical devices.
  • Detailed analysis of the country’s healthcare policy highlights, demographics, healthcare infrastructure, and healthcare expenditure.
  • An overview of the opportunities for and challenges to growth in the South Africa’s healthcare market.

Reasons to Buy

  • This report will enhance your decision-making capability by allowing you to:
  • Develop business strategies by understanding the trends shaping and driving the South Africa healthcare market
  • Drive revenues by understanding the key trends, reimbursement and regulatory policies, pharmaceutical market segments, and companies likely to impact the South Africa healthcare market in the future
  • Formulate effective sales and marketing strategies by understanding the competitive landscape and analyzing competitors’ performance
  • Organize your sales and marketing efforts by identifying the market categories and segments that present the most opportunities for consolidation, investment and strategic partnership

Table of Contents

1. Table of Contents

1.1 List of Figures

1.2 List of Tables

2. Executive Summary

2.1 Executive Summary

2.2 Key Highlights: Facts about the South Africa Healthcare Market

2.3 Key Highlights: Healthcare Startups in South Africa

2.4 Key Events: South Africa Healthcare Industry, 2015–21

2.5 Key Events: South Africa Pharmaceutical Market

2.6 Key Events: M&As, VC & PE Deals, Global Pharmaceutical Market, 2020–22

2.7 Key Events: Top Completed Deals by Value, 2020-22

2.8 Country Profile, South Africa, 2022

3. Overview of the Pharmaceutical Market

3.1 Pharmaceutical Market – Overview

3.2 Pharmaceutical Market – Exports

3.3 Pharmaceutical Market – Imports

3.4 Pharmaceutical Market – Supply Channels, South Africa

3.5 Pharmaceutical Market – Market Segments

3.6 Major Therapeutic Areas, South Africa

3.7 COVID-19 Epidemiology, South Africa

3.8 COVID-19 Impact and Developments, South Africa

3.9 COVID-19 Impact and Developments in the Healthcare Market, South Africa

3.10 COVID-19 Clinical Trials Landscape, South Africa

3.11 Pharmaceutical Market – Major Players

4. Overview of Medical Devices Market

4.1 Medical Device Market – Overview

4.2 Medical Devices Market – Major Players

5. Pharmaceutical and Medical Devices Market – Drivers and Barriers

5.1 Drivers

5.2 Barriers

6. Deal Analysis

6.1 Deal Analysis: Pharmaceutical Market, South Africa, 2019–22

6.2 Deal Analysis: Medical Device Market, South Africa, 2019–22

7. HealthTech Landscape

7.1 HealthTech Landscape, South Africa

7.2 Digital Statistics, South Africa

7.3 Adoption of Technology in Healthcare, South Africa

7.4 HealthTech Deals Landscape, South Africa

7.5 Key HealthTech Deals, South Africa

7.6 Digital Regulations, South Africa

7.7 HealthTech Landscape: Benefits and Risks, South Africa

8. Market Access

8.8.1 Overview of healthcare system, South Africa

8.8.2 Reimbursement Landscape, South Africa

8.8.3 Overview of Insurance providers, South Africa

8.8.4 Out-of-Pocket Spending and Pharmaceutical Price Index, South Africa

8.8.5 Pricing policies, South Africa

8.8.6 Market Access Timeline, South Africa, 2014–20

8.8.7 Overview of Regulatory Agencies, South Africa

8.8.8 Marketing Authorization for Pharmaceutical Products, South Africa

8.8.9 Marketing Authorization for Medical Devices, South Africa

8.8.10 Medical Device Clinical Trials Landscape, South Africa

8.8.11 IPR, Patents, South Africa

8.8.12 Pharmaceutical Clinical Trials Landscape, South Africa

8.8.13 Medical device Clinical Trials Landscape, South Africa

8.8.14 Pharmaceutical and Medical Device Advertising Regulations, South Africa

8.8.15 Licensing Process for Pharmaceutical and Medical Device Manufacturing, South Africa

8.8.16 Licensing Process for Pharmaceutical Exports and Imports, South Africa

8.8.17 Pharmacy Regulations, South Africa

8.8.18 Labeling and Packaging Regulations, South Africa

9. Country Healthcare Landscape

9.1 South Africa Healthcare Policy Highlights

9.2 Healthcare Facilities, South Africa

9.3 Life Expectancy, South Africa

9.4 Immunization Rate, South Africa

9.5 Environmental Health, South Africa

9.6 Healthcare Personnel, South Africa

9.7 Disease Burden, South Africa

9.8 Healthcare Expenditure, South Africa

10 Trade Associations, South Africa

11 Trade Fairs, South Africa

12 Opportunities and Challenges

13 Appendix

13.1 Research Methodology

13.1.1 Coverage

13.1.2 Secondary Research

13.1.3 Forecasts

13.2 Bibliography

13.3 About GlobalData

13.4 Contact Us

13.5 Disclaimer

Table

Table 1: Top five companies in OTC healthcare (value share % by brand), South Africa, 2021

Table 2: COVID-19 indicators, global and South Africa, 2022

Table 3: COVID-19-related travel restrictions, South Africa, 2020–22

Table 4: COVID-19 vaccine doses, immunocompromised adults, South Africa, 2021–22

Table 5: COVID-19 vaccine doses, immunocompromised adults, South Africa, 2021–22

Table 6: Authorized COVID-19 vaccines, South Africa, 2020–22

Table 7: Pipeline COVID-19 vaccines, South Africa, 2020–22

Table 8: Available COVID-19 IVD products, South Africa, 2020–22

Table 9: Pipeline COVID-19 IVD products, South Africa, 2020–22

Table 10: Medical devices market, major segments ($M), South Africa, 2021

Table 11: Hospital supplies market, revenue ($M) and market share (%) of major companies, South Africa, 2021

Table 12: General surgery market, revenue ($M) and market share (%) of major companies, South Africa, 2021

Table 13: Cardiovascular devices market, revenue ($M) and market share (%) of major companies, South Africa, 2021

Table 14: Orthopedic devices market, revenue ($M) and market share (%) of major companies, South Africa, 2021

Table 15: Dental devices market, revenue ($M) and market share (%) of major companies, South Africa, 2021

Table 16: South Africa Government Employees Medical Scheme, South Africa, 2022

Table 17: Maximum price for medicines (excluding VAT), South Africa, 2022

Table 18: Marketing authorization fees, South Africa, 2021

Table 19: Medical device classification, South Africa, 2022

Table 20: Patent fees ($), South Africa, 2022

Table 21: Clinical trial application fee, South Africa, 2022

Table 22: Pharmacy registration/maintenance fees, South Africa, 2022

Table 23: Health strategic plan 2020–21 to 2024–25, key risks, South Africa, 2022

Table 24: Trade fairs, South Africa, 2022

Figures

Figure 1: Pharmaceutical market, revenue ($B and ZARB), South Africa, 2013–21

Figure 2: Medical devices market, revenue ($B), South Africa, 2016–21

Figure 3: Healthcare startups in South Africa, 2022

Figure 4: Country profile, South Africa, 2022

Figure 5: Pharmaceutical market, revenue ($B and ZAR), South Africa, 2013–21

Figure 6: Pharmaceutical market, revenue forecast ($B and ZAR), South Africa, 2022–26

Figure 7: Pharmaceutical exports ($M), South Africa, 2011–21

Figure 8: Top export partners, South Africa, 2021

Figure 9: Pharmaceutical imports ($B), South Africa, 2011–21

Figure 10: Top import partners, South Africa, 2021

Figure 11: Pharmaceutical supply chain, South Africa, 2022

Figure 12: Integrated approach to improve efficiency of access to medicines, South Africa, 2022

Figure 13: Central Chronic Medicine Dispensing and Distribution (CCMDD), pharmaceutical market, South Africa, 2022

Figure 14: Causes of supply chain vulnerability, pharmaceutical market, South Africa, 2022

Figure 15: Legislative framework, counterfeiting drugs, South Africa, 2022

Figure 16: Avenues to combat counterfeiters, pharmaceutical market, South Africa, 2022

Figure 17: Number of generics approved, pharmaceutical market, Africa, 2019–20

Figure 18: Generic uptake rate (%) by disease, pharmaceutical market, South Africa, 2017

Figure 19: Top 4 domestic pharmaceutical manufacturers (revenue $M), South Africa, 2021

Figure 20: Key products, domestic pharmaceutical manufacturers (revenue $M), South Africa, 2021

Figure 21: OTC medicines market, market value ($M), South Africa, 2014–22

Figure 22: Major OTC drug classes (share %), South Africa, 2022

Figure 23: OTC medicines sales by channel ($M), South Africa, 2021

Figure 24: OTC drug categories (market value, $M), South Africa, 2022

Figure 25: Number of drugs registered by unique API for top therapeutic area, South Africa, 2021

Figure 26: COVID-19 (cumulative number of cases), South Africa, 2020–22

Figure 27: COVID-19 (cumulative number of deaths), South Africa, 2020–22

Figure 28: COVID-19 fiscal stimulus timeline, South Africa, 2020–22

Figure 29: COVID-19 stringency index, South Africa, 2020–22

Figure 30: COVID-19 containment and health index, South Africa, 2020–22

Figure 31: COVID-19 vaccine dose administration (number of administered vaccine doses), South Africa, 2021–22

Figure 32: Total number of individuals vaccinated (age group), South Africa, 2020–22

Figure 33: Top COVID-19 markets by equipment type (number of available marketed products), South Africa, 2020–22

Figure 34: Top COVID-19 products by product categories (number of available marketed products), South Africa, 2020–22

Figure 35: Companies manufacturing COVID-19 NAATS and POC tests (number of available marketed products), South Africa, 2020–22

Figure 36: Top COVID-19 NAATS (number of available marketed products), South Africa, 2020–22

Figure 37: COVID-19 clinical trials sponsors by count, South Africa, 2020–22

Figure 38: COVID-19 clinical trials count by phase, South Africa, 2020–22

Figure 39: COVID-19 clinical trials count by trial status, South Africa, 2020–22

Figure 40: Medical devices market, revenue ($B), South Africa, 2016–21

Figure 41: Medical devices market, revenue forecast ($B), South Africa, 2022–27

Figure 42: Medical devices market, major segments (%), South Africa, 2021

Figure 43: Hospital supplies market, revenue ($M), South Africa, 2017–25

Figure 44: Hospital supplies market, market share of major players (%), South Africa, 2021

Figure 45: General surgery market, revenue ($M), South Africa, 2017–25

Figure 46: General surgery market, market share of major players (%), South Africa, 2021

Figure 47: Cardiovascular devices market, revenue ($M), South Africa, 2017–25

Figure 48: Cardiovascular devices market, market share of major players (%), South Africa, 2021

Figure 49: Orthopedic devices market, revenue ($M), South Africa, 2017–25

Figure 50: Orthopedic devices market, market share of major players (%), South Africa, 2021

Figure 51: Dental devices market, revenue ($M), South Africa, 2017–25

Figure 52: Dental devices market, market share of major players (%), South Africa, 2021

Figure 53: Diagnostic market, revenue ($M), South Africa, 2016–21

Figure 54: Diagnostic market, revenue ($B), South Africa, 2022–27

Figure 55: Medical devices market, revenue ($B) of major companies, South Africa, 2021

Figure 56: Deals value and deal count, pharmaceutical market, South Africa, 2019–22

Figure 57: Deals value and deal count, quarterly, pharmaceutical market, South Africa, 2019–22

Figure 58: Deals value and deal count, subtypes, pharmaceutical market, South Africa, 2019–22

Figure 59: Top therapy areas by deal value ($M), pharmaceutical market, South Africa, 2019–22

Figure 60: Top therapy areas by deal count, pharmaceutical market, South Africa, 2019–22

Figure 61: M&A deals by quarter (by value and by number), pharmaceutical market, South Africa, 2019–22

Figure 62: VC deals by quarter (by value and by number), pharmaceutical market, South Africa, 2019–22

Figure 63: Deals value and deal count, medical devices market, South Africa, 2019–22

Figure 64: Deals value and deal count, quarterly, medical devices market, South Africa, 2019–22

Figure 65: Deals value and deal count, subtypes, medical devices market, South Africa, 2019–22

Figure 66: Top equipment sectors by deal value ($M), medical devices market, South Africa, 2019–22

Figure 67: Top equipment sectors by deal count, medical devices market, South Africa, 2019–22

Figure 68: M&A deals by quarter (by value and by number), medical devices market, South Africa, 2019–22

Figure 69: Healthtech ecosystem, South Africa, 2022

Figure 70: Digital Health Strategy, mission and vision, South Africa, 2022

Figure 71: Nine strategic objectives, Digital Health Strategy, South Africa, 2022

Figure 72: Key stakeholders, Digital Health Strategy, South Africa, 2022

Figure 73: Government-sponsored schemes promoting startups, South Africa, 2022

Figure 74: Deals value ($M), Healthtech, South Africa, 2019–22

Figure 75: Deal count (number of deals), Healthtech, South Africa, 2019–22

Figure 76: Organization of public healthcare system, South Africa, 2022

Figure 77: Statutory bodies for the health-service professionals, South Africa, 2022

Figure 78: Organizational structure of drugs regulatory authorities, South Africa, 2022

Figure 79: Process of addition to essential drugs list, healthcare system, South Africa, 2022

Figure 80: Determining analysis required for a health technology assessment, South Africa, 2022

Figure 81: Out-of-pocket spending ($ per capita), South Africa, 2011–21

Figure 82: Annual rate of change (%), health price index, South Africa, 2012–21

Figure 83: Pre-evaluation screening process, SAHPRA, regulatory landscape, South Africa, 2022

Figure 84: New drug approval process, regulatory landscape, South Africa, 2022

Figure 85: Registration process, class B, C, D, and IVD, South Africa, 2022

Figure 86: Patent approval process, South Africa, 2022

Figure 87: Trademark registration process, South Africa, 2022

Figure 88: Pharmaceutical clinical trials count by trial status, South Africa, 2020–22

Figure 89: Pharmaceutical clinical trials count by phase, South Africa, 2020–22

Figure 90: Pharmaceutical clinical trials count by indication, South Africa, 2020–22

Figure 91: Top five pharmaceutical clinical trials sponsors by count, South Africa, 2020–22

Figure 92: Medical devices clinical trials count by trial status, South Africa, 2020–22

Figure 93: Medical devices clinical trials count by indication, South Africa, 2020–22

Figure 94: Medical devices clinical trials count by device category, South Africa, 2020–22

Figure 95: Top five medical devices clinical trials sponsors by count, South Africa, 2020–22

Figure 96: Advertising product claims, South Africa, 2022

Figure 97: Labelling of drugs marketed, South Africa, 2022

Figure 98: National Development Policy 2030, sustainable development goal, South Africa, 2022

Figure 99: Goals of Human Resource Health Strategy (HRH) plan 2030, South Africa, 2022

Figure 100: Number of hospitals, South Africa, 2011–21

Figure 101: Number of diagnostic equipment units (per 100,000 Population), South Africa, 2015–22

Figure 102: Immunization rate (%), South Africa, 2013–21

Figure 103: Life expectancy at birth (years), South Africa, 2013–21

Figure 104: CO2 emissions (million tons), South Africa, 2011–21

Figure 105: PM2.5 (µg per m3), South Africa, 2010–21

Figure 106: Physicians (per 1,000 population), South Africa, 2011–21

Figure 107: Pharmacists (per 1,000 population), South Africa, 2011–21

Figure 108: Nurses (per 1,000 population), South Africa, 2011–21

Figure 109: Dentists (per 1,000 population), South Africa, 2011–21

Figure 110: DALYs by major disease (per 100,000 population), South Africa, 2019

Figure 111: Major causes of male mortality (per 100,000 population), South Africa, 2019

Figure 112: Major causes of female mortality (per 100,000 population), South Africa, 2019

Figure 113: Major causes of mortality (per 100,000 population), South Africa, 2019

Figure 114: Healthcare expenditure as percentage of GDP (%), South Africa, 2011–19

Figure 115: Public-private share (% of total health spending), South Africa, 2011–18

Figure 116: Healthcare expenditure (% of consolidated government expenditure), South Africa, 2016–20

Figure 117: Gross domestic spending on R&D ($B), South Africa, 2010–17

Figure 118: Pharmaceutical spending (% of health expenditure), South Africa, 2016–22

Frequently asked questions

South Africa Healthcare (Pharma and Medical Devices) Market Analysis, Regulatory, Reimbursement and Competitive Landscape thematic reports
Currency USD
$1,995

Can be used by individual purchaser only

$3,990

Can be shared globally by unlimited users within the purchasing corporation e.g. all employees of a single company


Undecided about purchasing this report?

Enquire Before Buying Request a Free Sample

Get in touch to find out about multi-purchase discounts

reportstore@globaldata.com
Tel +44 20 7947 2745

Every customer’s requirement is unique. With over 220,000 construction projects tracked, we can create a tailored dataset for you based on the types of projects you are looking for. Please get in touch with your specific requirements and we can send you a quote.

Sample Report

South Africa Healthcare (Pharma and Medical Devices) Market Analysis, Regulatory, Reimbursement and Competitive Landscape was curated by the best experts in the industry and we are confident about its unique quality. However, we want you to make the most beneficial decision for your business, so we offer free sample pages to help you:

  • Assess the relevance of the report
  • Evaluate the quality of the report
  • Justify the cost

Download your copy of the sample report and make an informed decision about whether the full report will provide you with the insights and information you need.

Below is a sample report to understand what you are buying

See what our customers are saying

“The GlobalData platform is our go-to tool for intelligence services. GlobalData provides an easy way to access comprehensive intelligence data around multiple sectors, which essentially makes it a one-for-all intelligence platform, for tendering and approaching customers.

GlobalData is very customer orientated, with a high degree of personalised services, which benefits everyday use. The highly detailed project intelligence and forecast reports can be utilised across multiple departments and workflow scopes, from operational to strategic level, and often support strategic decisions. GlobalData Analytics and visualisation solutions has contributed positively when preparing management presentations and strategic papers.”

Business Intelligence & Marketing Manager, SAL Heavy Lift

“COVID-19 has caused significant interference to our business and the COVID-19 intelligence from GlobalData has helped us reach better decisions around strategy. These two highlights have helped enormously to understand the projections into the future concerning our business units, we also utilise the project database to source new projects for Liebherr-Werk to use as an additional source to pitch for new business.”

Market Analyst & Management, Liebherr-Werk

Your daily news has saved me a lot of time and keeps me up-to-date with what is happening in the market, I like that you almost always have a link to the source origin. We also use your market data in our Strategic Business Process to support our business decisions. By having everything in one place on the Intelligence Center it has saved me a lot of time versus looking on different sources, the alert function also helps with this.

Head of Key Accounts, Saab AB

Having used several other market research companies, I find that GlobalData manages to provide that ‘difficult-to-get’ market data that others can’t, as well as very diverse and complete consumer surveys.

Marketing Intelligence Manager, Portugal Foods

Our experience with GlobalData has been very good, from the platform itself to the people. I find that the analysts and the account team have a high level of customer focus and responsiveness and therefore I can always rely on. The platform is more holistic than other providers. It is convenient and almost like a one stop shop. The pricing suite is highly competitive and value for our organisation.

I like reports that inform new segments such as the analysis on generation Z, millennials, the impact of COVID 19 to our banking customers and their new channel habits. Secondly the specialist insight on affluent sector significantly increases our understanding about this group of customers. The combination of those give us depth and breadth of the evolving market.

I’m in the business of answering and helping people make decisions so with the intelligence center I can do that, effectively and efficiently. I can share quickly key insights that answer and satisfy our country stakeholders by giving them many quality studies and primary research about competitive landscape beyond the outlook of our bank. It helps me be seen as an advisory partner and that makes a big difference. A big benefit of our subscription is that no one holds the whole data and because it allows so many people, so many different parts of our organisation have access, it enables all teams to have the same level of knowledge and decision support.

Head of Customer Insight and Research, Standard Chartered

“I know that I can always rely on Globaldata’s work when I’m searching for the right consumer and market insights. I use Globaldata insights to understand the changing market & consumer landscape and help create better taste & wellbeing solutions for our customers in food, beverage and healthcare industries.

Globaldata has the right data and the reports are of very high quality compared to your competitors. Globaldata not only has overall market sizes & consumer insights on food & beverages but also provides insights at the ingredient & flavour level. That is key for B2B companies like Givaudan. This way we understand our customers’ business and also gain insight to our unique industry”

Head of Consumer Sensory Insights, Givaudan

GlobalData provides a great range of information and reports on various sectors that is highly relevant, timely, easy to access and utilise.  The reports and data dashboards help engagement with clients; they provide valuable industry and market insights that can enrich client conversations and can help in the shaping of value propositions. Moreover, using GlobalData products has helped increase my knowledge of the finance sector, the players within it, and the general threats and opportunities.

I find the consumer surveys that are carried out to be extremely beneficial and not something I have seen anywhere else. They provided an insightful view of why and which consumers take (or don’t) particular financial products. This can help shape conversations with clients to ensure they make the right strategic decisions for their business.

One of the challenges I have found is that data in the payments space is often piecemeal. With GD all of the data I need is in one place, but it also comes with additional market reports that provide useful extra context and information. Having the ability to set-up alerts on relevant movements in the industry, be it competitors or customers, and have them emailed directly to me, ensures I get early sight of industry activity and don’t have to search for news.

Senior Account Manager, TSYS
Go even deeper with GlobalData Intelligence Center

Every Company Report we produce is powered by the GlobalData Intelligence Center.

Subscribing to our intelligence platform means you can monitor developments at South Africa Healthcare (Pharma and Medical Devices) Market Analysis, Regulatory, Reimbursement and Competitive Landscape in real time.

  • Access a live South Africa Healthcare (Pharma and Medical Devices) Market Analysis, Regulatory, Reimbursement and Competitive Landscape dashboard for 12 months, with up-to-the-minute insights.
  • Fuel your decision making with real-time deal coverage and media activity.
  • Turn insights on financials, deals, products and pipelines into powerful agents of commercial advantage.