Polycarbonate Industry Capacity and Capital Expenditure Forecasts with Details of Active and Planned Plants to 2027

Powered by

All the vital news, analysis, and commentary curated by our industry experts.

Polycarbonate Industry Capacity & CapEx Overview

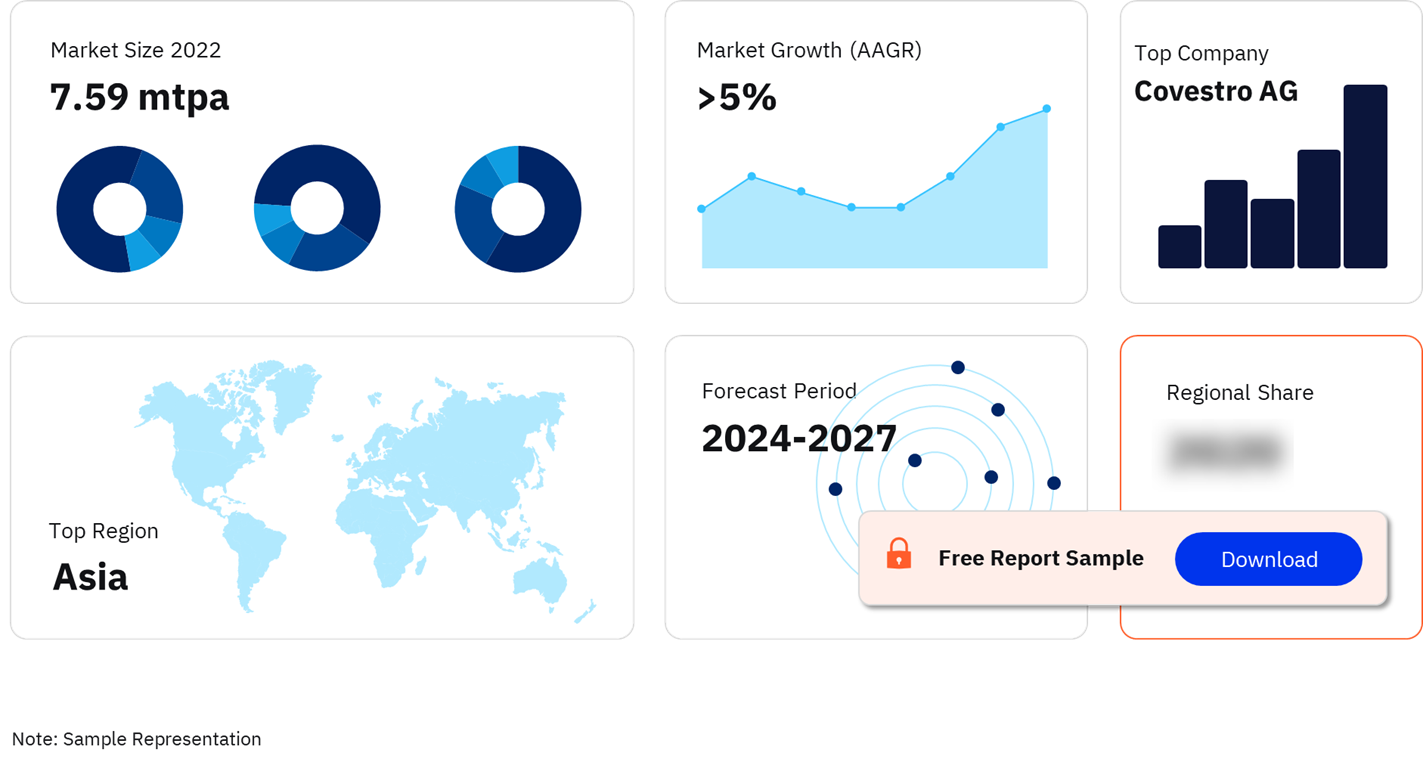
The polycarbonate industry capacity was 7.59 million tonnes per annum (mtpa) in 2022 and is expected to increase at an AAGR of more than 5% during 2022-2027.

Polycarbonate Industry Capacity and CapEx Outlook, 2022-2027 (mtpa)

Polycarbonate Industry Capacity and CapEx Outlook, 2022-2027 (mtpa)

Buy the Full Report for More Insights on Polycarbonate Capacity and Capex Market Forecast

Download a Free Report Sample

The polycarbonate industry capacity and capital expenditure outlook provides updated information on all active, planned, and announced polycarbonate industry projects globally for all regions and related countries. The historical and forecast evaluation of the polycarbonate industry capacity data report will help you in informed decision-making for future business strategies.

Market Capacity 2022 7.59 Mtpa
AAGR (2022-2027) >5%
Historical Period 2017-2023
Forecast Period 2024-2027
Key Regions ·        Asia

·        Europe

·        North America

·        Middle East

·        Former Soviet Union (FSU)

Key Countries ·        China

·        The US

·        South Korea

·        Thailand

·        Germany

Leading Companies ·        Covestro AG

·        Saudi Basic Industries Corp

·        Lotte Chemical Corp

·        Teijin Ltd

·        Mitsubishi Gas Chemical Co Inc.

Enquire & Decide Discover the perfect solution for your business needs. Enquire now and let us help you make an informed decision before making a purchase.

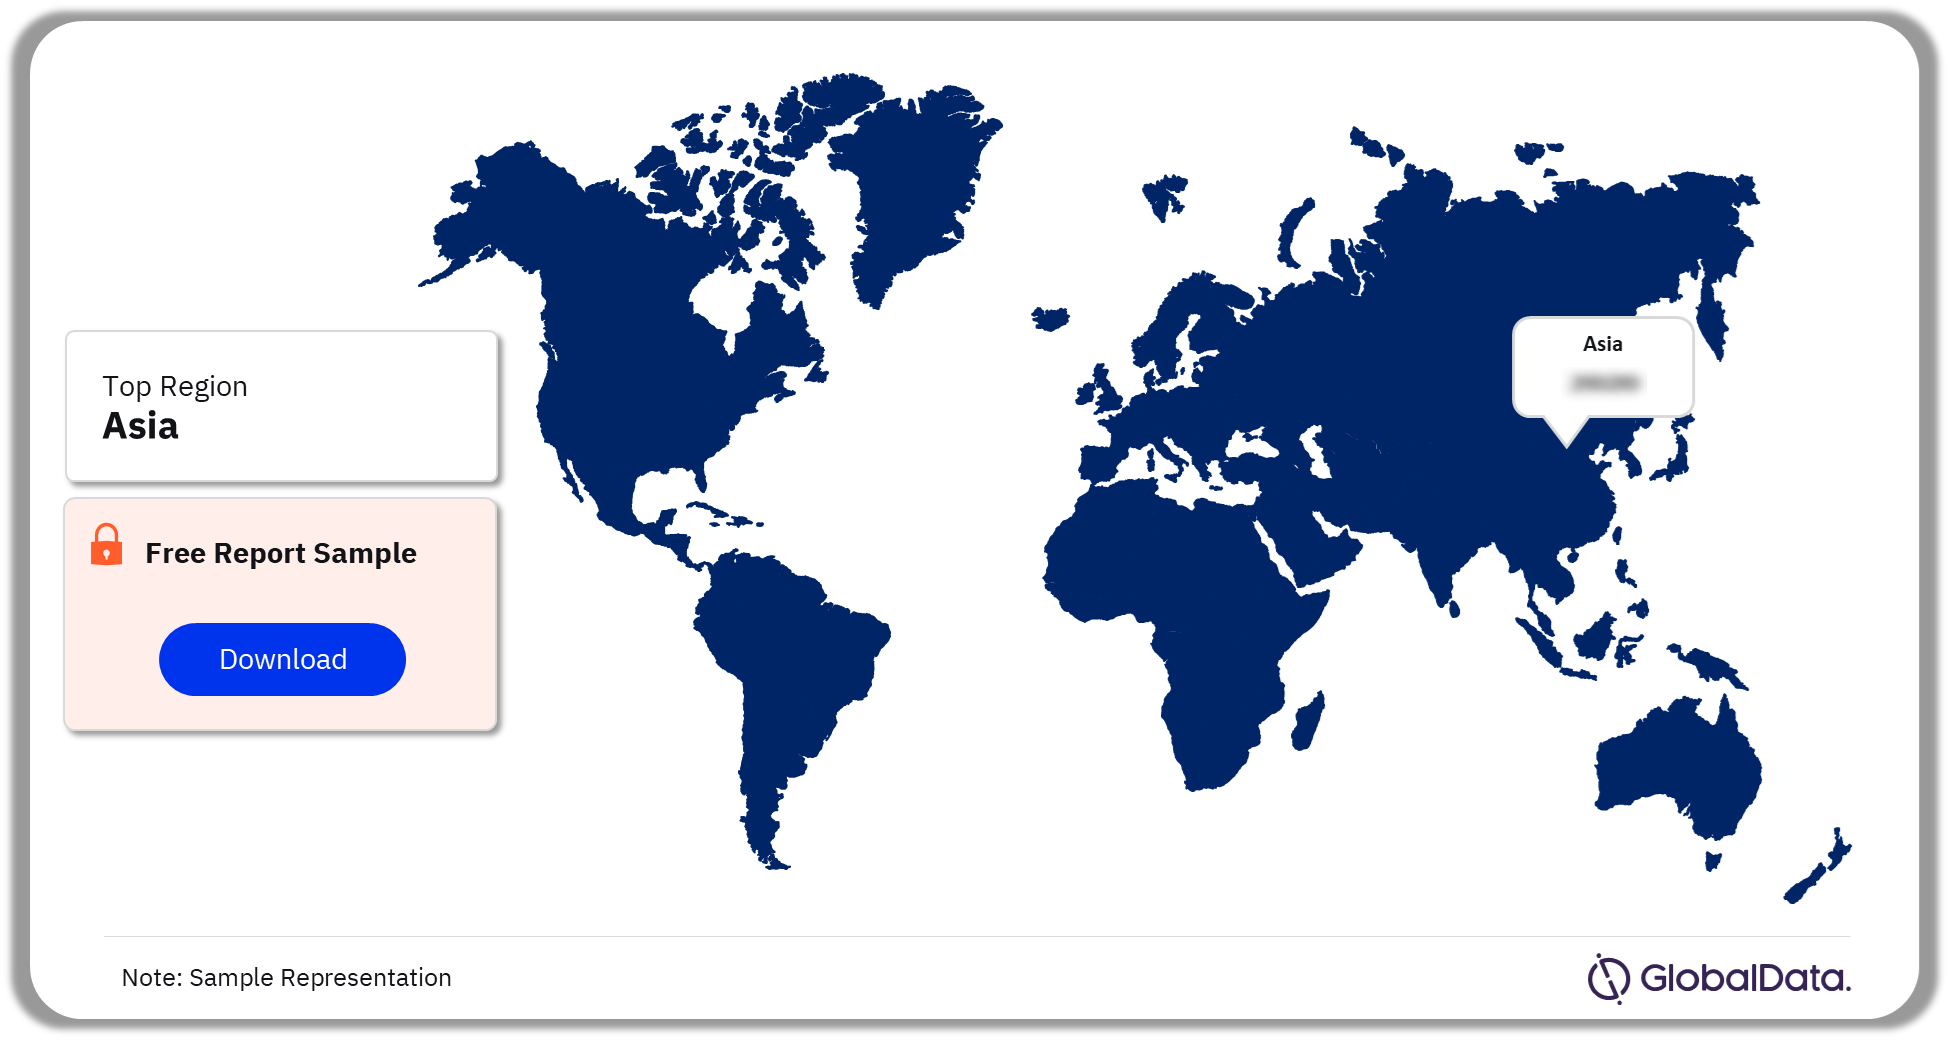
Polycarbonate Industry Capacity Contribution by Regions

The key polycarbonate industry capacity contributors include Asia, Europe, North America, the Middle East, and the Former Soviet Union (FSU). Among regions, Asia leads with the largest capacity contribution globally and will continue to dominate over the next five years. Europe and North America are the following revenue contributors. In 2022, China was the largest capacity contributor in Asia.

Polycarbonate Industry Market Analysis by Regions, 2022 (%)

Polycarbonate Industry Market Analysis by Regions, 2022 (%)

Buy the Full Report for More Insights into the Polycarbonate Industry Regional Capacity Contribution

Download a Free Report Sample

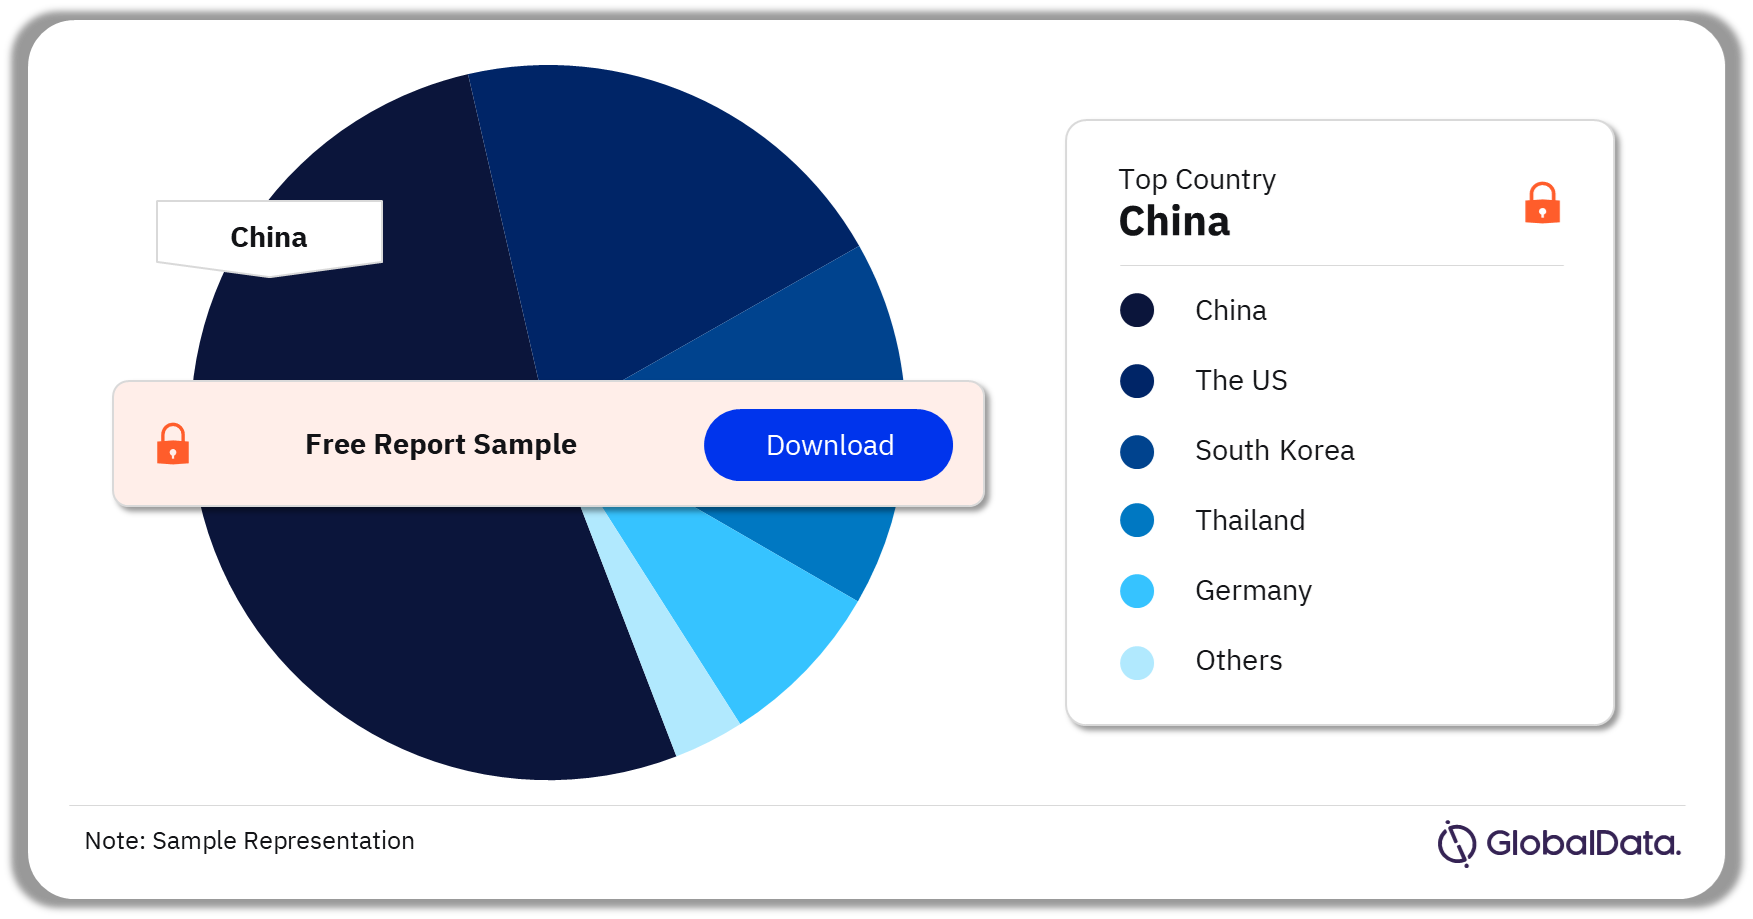
Polycarbonate Industry Capacity Contribution by Countries

Among the key countries, China led with the largest capacity contribution globally in 2022. The key countries besides China, with active capacity contributions to the polycarbonate market, are the US, South Korea, Thailand, and Germany, among others.

Polycarbonate Industry Market Analysis by Countries, 2022 (%)

Polycarbonate Industry Market Analysis by Countries, 2022 (%)

Buy the Full Report for More Insights into the Polycarbonate Industry Country Capacity Contribution

Download a Free Report Sample

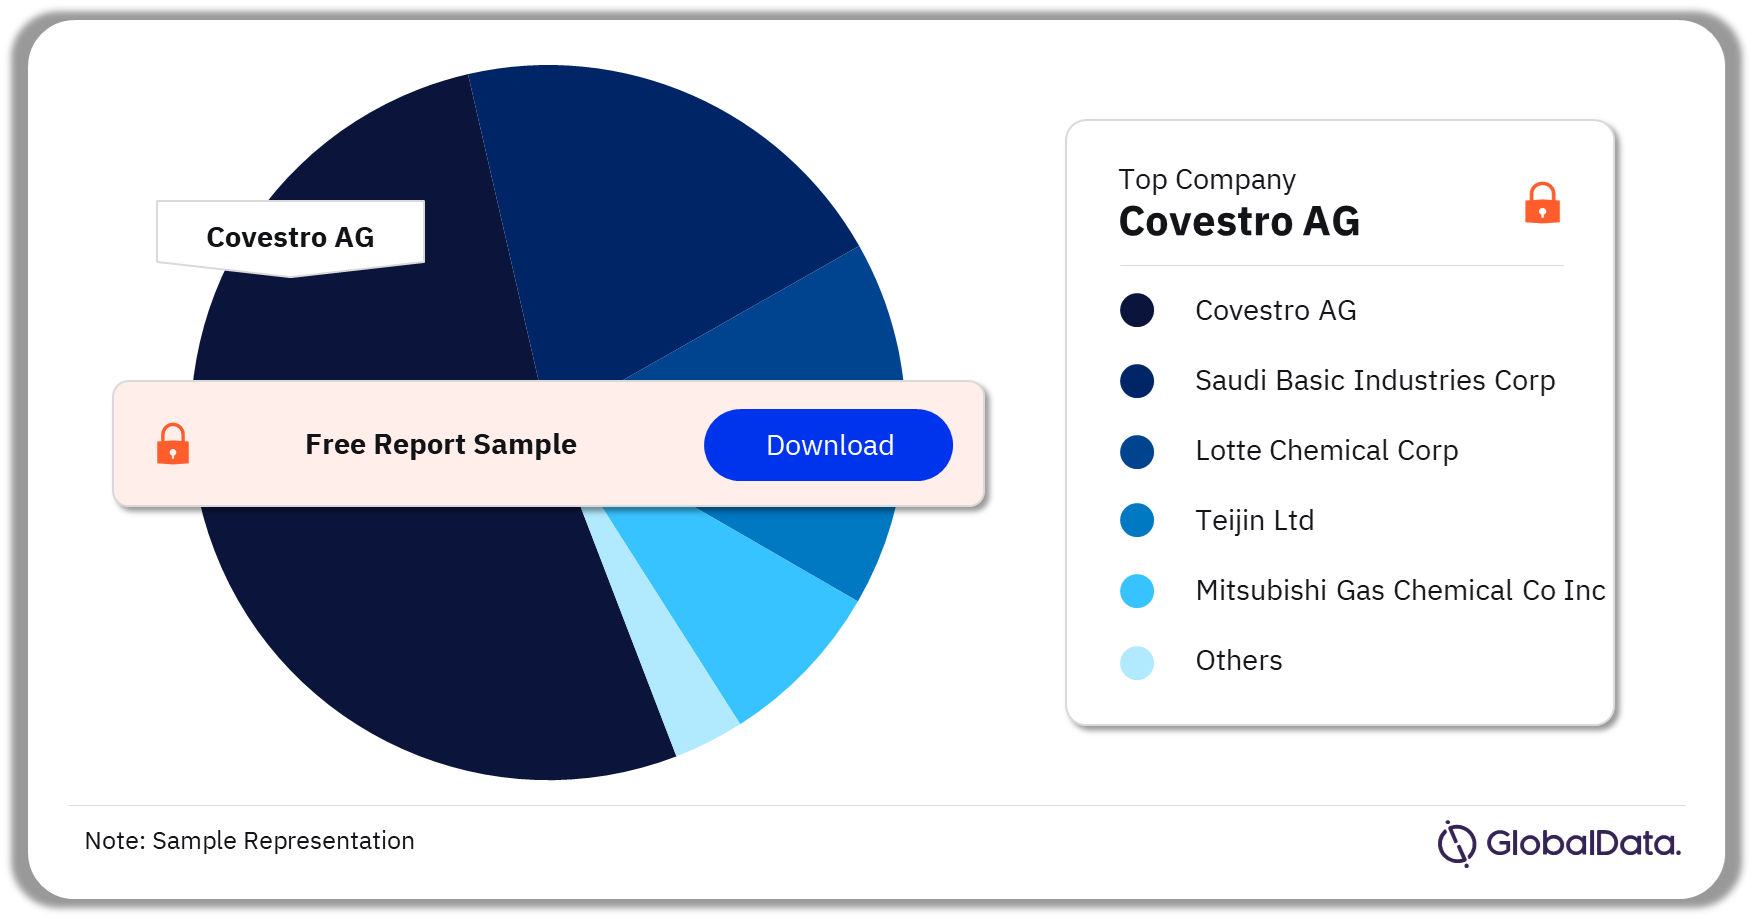
Polycarbonate Industry Market - Competitive Landscape

A few of the key companies in the global polycarbonate industry are Covestro AG, Saudi Basic Industries Corp, Lotte Chemical Corp, Teijin Ltd, and Mitsubishi Gas Chemical Co Inc. Covestro AG had the largest capacity with a major capacity contribution from Covestro Caojing Polycarbonate Plant 2.

Polycarbonate Industry Market Analysis by Companies, 2022 (%)

Polycarbonate Industry Market Analysis by Companies, 2022 (%)

Buy Full Report for More Insights on the Leading Companies in the Polycarbonate Industry

Download a Free Report Sample

Segments Covered in the Report

Polycarbonate Industry Capacity Contribution Regional Outlook (Capacity, mtpa, 2017-2027)

  • Asia
  • Europe
  • North America
  • Middle East
  • Former Soviet Union (FSU)

Polycarbonate Industry Capacity Contribution Country Outlook (Capacity, mtpa, 2017-2027)

  • China
  • The US
  • South Korea
  • Thailand
  • Germany

Scope

The report provides:

  • Global polycarbonate industry capacity outlook by region
  • Global polycarbonate outlook by country
  • Polycarbonate industry planned and announced projects details
  • Capacity share of the major polycarbonate producers globally
  • Global polycarbonate capital expenditure outlook by region
  • Global polycarbonate pcapital expenditure outlook by country

Reasons to Buy

  • Obtain the most up to date information available on all active, planned, and announced polycarbonate plants globally.
  • Identify opportunities in the global polycarbonate industry with the help of upcoming projects and capital expenditure outlook.
  • Facilitate decision-making on the basis of strong historical and forecast polycarbonate capacity data.

Reliance Industries Ltd
Shenma Industrial Co Ltd
Hengli Petrochemical (Dalian) Co Ltd
Saudi Basic Industries Corp
Covestro AG
Lotte Chemical Corp
Teijin Ltd

Table of Contents

Table of Contents

1. Introduction 8

What is This Report About? 8

Market Definition 8

2. Global Polycarbonate Capacity and Capital Expenditure Review 9

2.1 Global Polycarbonate Industry, An Overview 9

2.2 Global Polycarbonate Industry, Capacity by key countries 10

2.3 Global Polycarbonate Industry, Capacity Share vis-à-vis Growth by Key Countries, 2017–2022 11

2.4 Global Polycarbonate Industry, Top 10 Planned and Announced Projects 12

2.5 Global Polycarbonate Industry, Capacity contribution by region 14

2.6 Key Companies by Polycarbonate Capacity Contribution (% Share), 2022 15

2.7 Key Countries by Active Global Capacity Contribution to Polycarbonate Industry 17

2.8 Global Polycarbonate Industry, Installed Plant Capacity by Production Process, 2022 19

2.9 Regional Capacity Additions from Planned and Announced Projects 23

2.10 Global Capacity Additions from Planned and Announced Projects by Top 10 Countries 24

2.11 Global Capacity Additions from Planned and Announced Projects by Top 10 Companies 25

2.12 Regional Capex Spending on Planned and Announced Projects 27

2.13 Global Capex Spending on Planned and Announced Projects by countries 28

3. Global Planned and Announced Polycarbonate Projects 29

4. Asia Polycarbonate Industry 32

4.1 Asia Polycarbonate Industry, An Overview 32

4.2 Asia Polycarbonate Industry, Capacity by Key Countries, 2017–2027 33

4.3 Asia Polycarbonate Industry, Capacity Share vis-à-vis Growth by Key Countries, 2017–2022 34

4.4 Asia Polycarbonate Industry, Installed Plant Capacity by Production Process, 2022 35

4.5 Asia Polycarbonate Industry, New Build and Expansion Capital Expenditure Outlook for Planned and Announced Projects 38

4.6 Asia Polycarbonate Industry, New Build and Expansion Capital Expenditure Outlook for Planned and Announced Projects by countries 39

4.7 Polycarbonate Industry in China 40

4.8 Polycarbonate Industry, South Korea 45

4.9 Polycarbonate Industry, Thailand 46

4.10 Polycarbonate Industry, Japan 47

4.11 Polycarbonate Industry, Taiwan 48

4.12 Polycarbonate Industry, India 49

5. Europe Polycarbonate Industry 50

5.1 Europe Polycarbonate Industry, An Overview 50

5.2 Europe Polycarbonate Industry, Capacity by Key Countries, 2017–2027 51

5.3 Europe Polycarbonate Industry, Capacity Share vis-à-vis Growth by Key Countries, 2017–2022 52

5.4 Europe Polycarbonate Industry, Installed Plant Capacity by Production Process, 2022 53

5.5 Europe Polycarbonate Industry, Installed Plant Capacity by Technology, 2022 55

5.6 Polycarbonate Industry, Germany 58

5.7 Polycarbonate Industry, Spain 59

5.8 Polycarbonate Industry, Netherlands 60

5.9 Polycarbonate Industry, Belgium 61

6. North America Polycarbonate Industry 62

6.1 North America Polycarbonate Industry, An Overview 62

6.2 North America Polycarbonate Industry, Capacity by Key Countries, 2017–2027 63

6.3 North America Polycarbonate Industry, Capacity Share vis-à-vis Growth by Key Countries, 2017–2022 64

6.4 North America Polycarbonate Industry, Installed Plant Capacity by Production Process, 2022 65

6.5 North America Polycarbonate Industry, Installed Plant Capacity by Technology, 2022 67

6.6 Polycarbonate Industry, United States 69

7. Middle East Polycarbonate Industry 70

7.1 Middle East Polycarbonate Industry, An Overview 70

7.2 Middle East Polycarbonate Industry, Capacity by Key Countries, 2017–2027 71

7.3 Middle East Polycarbonate Industry, Capacity Share vis-à-vis Growth by Key Countries, 2017–2022 72

7.4 Middle East Polycarbonate Industry, Installed Plant Capacity by Production Process, 2022 73

7.5 Middle East Polycarbonate Industry, Installed Plant Capacity by Technology, 2022 75

7.6 Polycarbonate Industry, Saudi Arabia 77

7.7 Polycarbonate Industry, Iran 78

8. Former Soviet Union (FSU) Polycarbonate Industry 79

8.1 FSU Polycarbonate Industry, An Overview 79

8.2 FSU Polycarbonate Industry, Capacity by Key Countries, 2017–2027 80

8.3 FSU Polycarbonate Industry, Capacity Share vis-à-vis Growth by Key Countries, 2017–2022 81

8.4 FSU Polycarbonate Industry, Installed Plant Capacity by Production Process, 2022 82

8.5 FSU Polycarbonate Industry, Installed Plant Capacity by Technology, 2022 83

8.6 Polycarbonate Industry, Russia 84

8.7 Polycarbonate Industry, Belarus 85

9. Appendix 86

9.1 Definitions 86

9.2 Abbreviations 87

9.3 Status Definition 87

9.4 Methodology 88

Contact Us 89

Table

List of Tables

Table 1: Polycarbonate Industry, Global, key statistics, 2022 9

Table 2: Polycarbonate Industry, Global, Capacity by Key Countries (mtpa), 2017–2027 10

Table 3: Polycarbonate Industry, Global, Top 10 Planned and Announced Projects Details, 2023–2027 12

Table 4: Polycarbonate Industry, Global, capacity by region (mtpa), 2022–2027 14

Table 5: Polycarbonate Industry, global, capacity share of top 10 Companies (%), 2022 16

Table 6: Polycarbonate Industry, global, active Capacity of Top 10 Countries (mtpa), 2022 18

Table 7: Global, Polycarbonate Industry, Installed Plant Capacity by Production Process (%) 2022 20

Table 8: Global Polycarbonate Industry, Installed Plant Capacity by Non-Phosgene Melt Polymerization process, 2022 20

Table 9: Global Polycarbonate Industry, Installed Plant Capacity by Interfacial Phosgenation process, 2022 21

Table 10: Propylene Industry, global, planned and announced capacity additions by region (mtpa), 2027 23

Table 11: Polycarbonate Industry, global, planned and announced capacity additions by top 10 countries (mtpa), 2027 24

Table 12: Polycarbonate Industry, global, planned and announced capacity additions by Top 10 Companies (mtpa), 2027 26

Table 13: Polycarbonate Industry, Global, Total Capex Spending on Planned and Announced Projects by Region ($ bil), 2023–2027 27

Table 14: Polycarbonate Industry, Global, Total Capex Spending on Planned and Announced Projects by Countries ($ bil), 2023–2027 28

Table 15: Global, planned and announced Polycarbonate projects details 29

Table 16: Polycarbonate Industry, Asia, key statistics, 2022 32

Table 17: Polycarbonate Industry, Asia, Capacity by Key Countries (mtpa), 2017–2027 33

Table 18: Asia, Polycarbonate Industry, Installed Plant Capacity by Production Process (%) 2022 36

Table 19: Asia, Polycarbonate Industry, Installed Plant Capacity by Non-Phosgene Melt Polymerization process, 2022 36

Table 20: Asia, Polycarbonate Industry, Installed Plant Capacity by Interfacial Phosgenation process, 2022 37

Table 21: Polycarbonate Industry, Asia, New Build and Expansion Capital Expenditure Outlook for Planned and Announced Projects ($B), 2023–2027 38

Table 22: Polycarbonate Industry, Asia, New Build and Expansion Capital Expenditure Outlook for Planned and Announced Projects by Countries ($B), 2023–2027 39

Table 23: Polycarbonate Industry, China, Capacity by Major Plants (mtpa) 2017–2027 40

Table 24: Polycarbonate Industry, South Korea, Capacity by Major Plants (mtpa) 2017–2027 45

Table 25: Polycarbonate Industry, Thailand, Capacity by Major Plants (mtpa) 2017–2027 46

Table 26: Polycarbonate Industry, Japan, Capacity by Major Plants (mtpa) 2017–2027 47

Table 27: Polycarbonate Industry, Taiwan, Capacity by Major Plants (mtpa) 2017–2027 48

Table 28: Polycarbonate Industry, India, Capacity by Major Plants (mtpa) 2017–2027 49

Table 29: Polycarbonate Industry, Europe, key statistics, 2022 50

Table 30: Polycarbonate Industry, Europe, Capacity by Key Countries (mtpa), 2017–2027 51

Table 31: Europe, Polycarbonate Industry, Installed Plant Capacity by Production Process (%) 2022 54

Table 32: Europe, Polycarbonate Industry, Installed Plant Capacity by Non-Phosgene Melt Polymerization process, 2022 54

Table 33: Europe, Polycarbonate Industry, Installed Plant Capacity by Interfacial Phosgenation process, 2022 54

Table 34: Europe, Polycarbonate Industry, Installed Plant Capacity by Technology (%) 2022 56

Table 35: Europe, Polycarbonate Industry, Installed Plant Capacity by Covestro Polycarbonate Technology, 2022 56

Table 36: Europe, Polycarbonate Industry, Installed Plant Capacity by GE Plastics Polycarbonate Technology, 2022 56

Table 37: Europe, Polycarbonate Industry, Installed Plant Capacity by Trineso Polycarbonate Technology, 2022 57

Table 38: Polycarbonate Industry, Germany, Capacity by Major Plants (mtpa) 2017–2027 58

Table 39: Polycarbonate Industry, Spain, Capacity by Major Plants (mtpa) 2017–2027 59

Table 40: Polycarbonate Industry, Netherlands, Capacity by Major Plants (mtpa) 2017–2027 60

Table 41: Polycarbonate Industry, Belgium, Capacity by Major Plants (mtpa) 2017–2027 61

Table 42: Polycarbonate Industry, North America, key statistics, 2022 62

Table 43: Polycarbonate Industry, North America, Capacity by Key Countries (mtpa), 2017–2027 63

Table 44: North America, Polycarbonate Industry, Installed Plant Capacity by Production Process (%) 2022 66

Table 45: North America Polycarbonate Industry, Installed Plant Capacity by Interfacial Phosgenation process, 2022 66

Table 46: North America Polycarbonate Industry, Installed Plant Capacity by Non-Phosgene Melt Polymerization process, 2022 66

Table 47: North America, Polycarbonate Industry, Installed Plant Capacity by Technology (%) 2022 68

Table 48: North America, Polycarbonate Industry, Installed Plant Capacity by GE Plastics Polycarbonate Technology, 2022 68

Table 49: North America, Polycarbonate Industry, Installed Plant Capacity by Covestro Polycarbonate Technology, 2022 68

Table 50: Polycarbonate Industry, the US, Capacity by Major Plants (mtpa) 2017–2027 69

Table 51: Polycarbonate Industry, Middle East, key statistics, 2022 70

Table 52: Polycarbonate Industry, Middle East, Capacity by Key Countries (mtpa), 2017–2027 71

Table 53: Middle East, Polycarbonate Industry, Installed Plant Capacity by Production Process (%) 2022 74

Table 54: Middle East, Polycarbonate Industry, Installed Plant Capacity by Non-Phosgene Melt Polymerization process, 2022 74

Table 55: Middle East, Polycarbonate Industry, Installed Plant Capacity by Interfacial Phosgenation process, 2022 74

Table 56: Middle East, Polycarbonate Industry, Installed Plant Capacity by Technology (%) 2022 76

Table 57: Middle East, Polycarbonate Industry, Installed Plant Capacity by Asahi Kasei Polycarbonate Technology, 2022 76

Table 58: Middle East, Polycarbonate Industry, Installed Plant Capacity by Salzgitter Polycarbonate Technology, 2022 76

Table 59: Polycarbonate Industry, Saudi Arabia, Capacity by Major Plants (mtpa) 2017–2027 77

Table 60: Polycarbonate Industry, Iran, Capacity by Major Plants (mtpa) 2017–2027 78

Table 61: Polycarbonate Industry, FSU, key statistics, 2022 79

Table 62: Polycarbonate Industry, FSU, Capacity by Key Countries (mtpa), 2017–2027 80

Table 63: Polycarbonate Industry, Russia, Capacity by Major Plants (mtpa) 2017–2027 84

Table 64: Polycarbonate Industry, Belarus, Capacity by Major Plants (mtpa) 2017–2027 85

Figures

List of Figures

Figure 1: Global Polycarbonate Industry, Capacity Share vis-à-vis Growth by Key Countries, 2017–2022 11

Figure 2: Polycarbonate Industry, global, capacity by region (mtpa), 2022–2027 14

Figure 3: Polycarbonate Industry, global, capacity share of top 10 companies (%), 2022 15

Figure 4: Polycarbonate Industry, global, active capacity of top 10 countries (mtpa), 2022 17

Figure 5: Global, Polycarbonate Industry, Installed Plant Capacity by Production Process (%) 2022 19

Figure 6: Polycarbonate Industry, global, planned and announced capacity additions by region (mtpa), 2027 23

Figure 7: Polycarbonate Industry, global, planned and announced Capacity Additions by Top 10 countries (mtpa), 2027 24

Figure 8: Polycarbonate Industry, global, planned and announced Capacity Additions by Top 10 companies (mtpa), 2027 25

Figure 9: Polycarbonate Industry, Total Capex Spending on Planned and Announced Projects by Region ($ bil), 2023–2027 27

Figure 10: Polycarbonate Industry, Total Capex Spending on Planned and Announced Projects by Countries ($ bil), 2023–2027 28

Figure 11: Polycarbonate Industry, Asia, Capacity Share vis-à-vis Growth by Key Countries, 2017–2022 34

Figure 12: Asia, Polycarbonate Industry, Installed Plant Capacity by Production Process (%) 2022 35

Figure 13: Polycarbonate Industry, Asia, New Build and Expansion Capital Expenditure Outlook for Planned and Announced Projects ($B), 2023–2027 38

Figure 14: Polycarbonate Industry, Asia, New Build and Expansion Capital Expenditure Outlook for Planned and Announced Projects by Countries ($B), 2023–2027 39

Figure 15: Polycarbonate Industry, Europe, Capacity Share vis-à-vis Growth by Key Countries, 2017–2022 52

Figure 16: Europe, Polycarbonate Industry, Installed Plant Capacity by Production Process (%) 2022 53

Figure 17: Europe, Polycarbonate Industry, Installed Plant Capacity by Technology (%) 2022 55

Figure 18: Polycarbonate Industry, North America, Capacity Share vis-à-vis Growth by Key Countries, 2017–2022 64

Figure 19: North America, Polycarbonate Industry, Installed Plant Capacity by Production Process (%) 2022 65

Figure 20: North America, Polycarbonate Industry, Installed Plant Capacity by Technology (%) 2022 67

Figure 21: Polycarbonate Industry, Middle East, Capacity Share vis-à-vis Growth by Key Countries, 2017–2022 72

Figure 22: Middle East, Polycarbonate Industry, Installed Plant Capacity by Production Process (%) 2022 73

Figure 23: Middle East, Polycarbonate Industry, Installed Plant Capacity by Technology (%) 2022 75

Figure 24: Polycarbonate Industry, FSU, Capacity Share vis-à-vis Growth by Key Countries, 2017–2022 81

Frequently asked questions

Polycarbonate Industry Capacity and Capital Expenditure Forecasts with Details of Active and Planned Plants to 2027 thematic reports
Currency USD
$3,995

Can be used by individual purchaser only

$11,985

Can be shared globally by unlimited users within the purchasing corporation e.g. all employees of a single company


Undecided about purchasing this report?

Enquire Before Buying Request a Free Sample

Get in touch to find out about multi-purchase discounts

reportstore@globaldata.com
Tel +44 20 7947 2745

Every customer’s requirement is unique. With over 220,000 construction projects tracked, we can create a tailored dataset for you based on the types of projects you are looking for. Please get in touch with your specific requirements and we can send you a quote.

Sample Report

Polycarbonate Industry Capacity and Capital Expenditure Forecasts with Details of Active and Planned Plants to 2027 was curated by the best experts in the industry and we are confident about its unique quality. However, we want you to make the most beneficial decision for your business, so we offer free sample pages to help you:

  • Assess the relevance of the report
  • Evaluate the quality of the report
  • Justify the cost

Download your copy of the sample report and make an informed decision about whether the full report will provide you with the insights and information you need.

Below is a sample report to understand what you are buying

See what our customers are saying

“The GlobalData platform is our go-to tool for intelligence services. GlobalData provides an easy way to access comprehensive intelligence data around multiple sectors, which essentially makes it a one-for-all intelligence platform, for tendering and approaching customers.

GlobalData is very customer orientated, with a high degree of personalised services, which benefits everyday use. The highly detailed project intelligence and forecast reports can be utilised across multiple departments and workflow scopes, from operational to strategic level, and often support strategic decisions. GlobalData Analytics and visualisation solutions has contributed positively when preparing management presentations and strategic papers.”

Business Intelligence & Marketing Manager, SAL Heavy Lift

“COVID-19 has caused significant interference to our business and the COVID-19 intelligence from GlobalData has helped us reach better decisions around strategy. These two highlights have helped enormously to understand the projections into the future concerning our business units, we also utilise the project database to source new projects for Liebherr-Werk to use as an additional source to pitch for new business.”

Market Analyst & Management, Liebherr-Werk

Your daily news has saved me a lot of time and keeps me up-to-date with what is happening in the market, I like that you almost always have a link to the source origin. We also use your market data in our Strategic Business Process to support our business decisions. By having everything in one place on the Intelligence Center it has saved me a lot of time versus looking on different sources, the alert function also helps with this.

Head of Key Accounts, Saab AB

Having used several other market research companies, I find that GlobalData manages to provide that ‘difficult-to-get’ market data that others can’t, as well as very diverse and complete consumer surveys.

Marketing Intelligence Manager, Portugal Foods

Our experience with GlobalData has been very good, from the platform itself to the people. I find that the analysts and the account team have a high level of customer focus and responsiveness and therefore I can always rely on. The platform is more holistic than other providers. It is convenient and almost like a one stop shop. The pricing suite is highly competitive and value for our organisation.

I like reports that inform new segments such as the analysis on generation Z, millennials, the impact of COVID 19 to our banking customers and their new channel habits. Secondly the specialist insight on affluent sector significantly increases our understanding about this group of customers. The combination of those give us depth and breadth of the evolving market.

I’m in the business of answering and helping people make decisions so with the intelligence center I can do that, effectively and efficiently. I can share quickly key insights that answer and satisfy our country stakeholders by giving them many quality studies and primary research about competitive landscape beyond the outlook of our bank. It helps me be seen as an advisory partner and that makes a big difference. A big benefit of our subscription is that no one holds the whole data and because it allows so many people, so many different parts of our organisation have access, it enables all teams to have the same level of knowledge and decision support.

Head of Customer Insight and Research, Standard Chartered

“I know that I can always rely on Globaldata’s work when I’m searching for the right consumer and market insights. I use Globaldata insights to understand the changing market & consumer landscape and help create better taste & wellbeing solutions for our customers in food, beverage and healthcare industries.

Globaldata has the right data and the reports are of very high quality compared to your competitors. Globaldata not only has overall market sizes & consumer insights on food & beverages but also provides insights at the ingredient & flavour level. That is key for B2B companies like Givaudan. This way we understand our customers’ business and also gain insight to our unique industry”

Head of Consumer Sensory Insights, Givaudan

GlobalData provides a great range of information and reports on various sectors that is highly relevant, timely, easy to access and utilise.  The reports and data dashboards help engagement with clients; they provide valuable industry and market insights that can enrich client conversations and can help in the shaping of value propositions. Moreover, using GlobalData products has helped increase my knowledge of the finance sector, the players within it, and the general threats and opportunities.

I find the consumer surveys that are carried out to be extremely beneficial and not something I have seen anywhere else. They provided an insightful view of why and which consumers take (or don’t) particular financial products. This can help shape conversations with clients to ensure they make the right strategic decisions for their business.

One of the challenges I have found is that data in the payments space is often piecemeal. With GD all of the data I need is in one place, but it also comes with additional market reports that provide useful extra context and information. Having the ability to set-up alerts on relevant movements in the industry, be it competitors or customers, and have them emailed directly to me, ensures I get early sight of industry activity and don’t have to search for news.

Senior Account Manager, TSYS
Go even deeper with GlobalData Intelligence Center

Every Company Report we produce is powered by the GlobalData Intelligence Center.

Subscribing to our intelligence platform means you can monitor developments at Polycarbonate Industry Capacity and Capital Expenditure Forecasts with Details of Active and Planned Plants to 2027 in real time.

  • Access a live Polycarbonate Industry Capacity and Capital Expenditure Forecasts with Details of Active and Planned Plants to 2027 dashboard for 12 months, with up-to-the-minute insights.
  • Fuel your decision making with real-time deal coverage and media activity.
  • Turn insights on financials, deals, products and pipelines into powerful agents of commercial advantage.