Refinery Condensate Splitter Units Market Installed Capacity and Capital Expenditure (CapEx) Forecast by Region and Countries including details of All Active Plants, Planned and Announced Projects, 2022-2026

Powered by

All the vital news, analysis, and commentary curated by our industry experts.

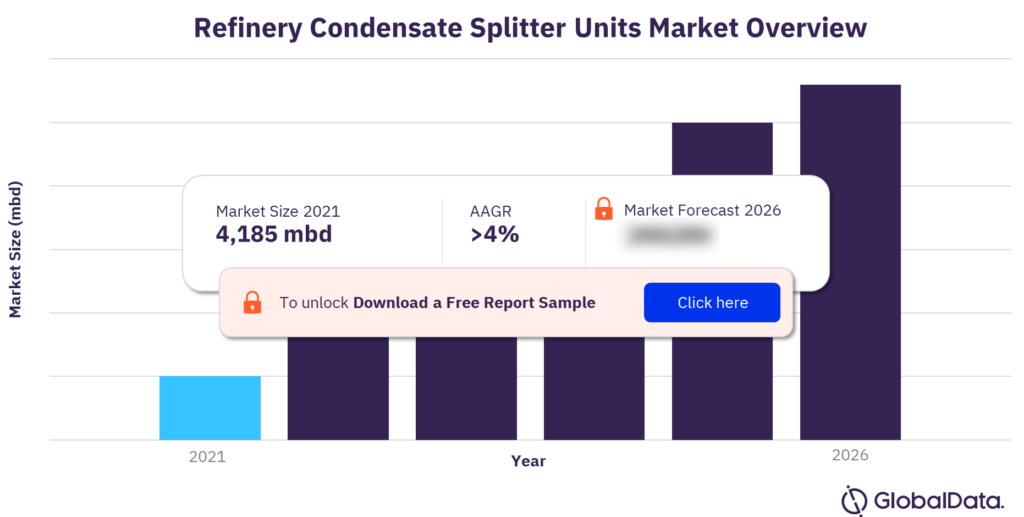
The global refinery condensate splitter units capacity was 4,185 mbd in 2021. The market is projected to grow at an AAGR of more than 4% from 2021 to 2026. The UAE, South Korea, Iran, the US, and Qatar are the major countries that accounted for most of the total global condensate splitter units capacity in 2021.

The refinery condensate splitter units market research report provides details such as the refinery name, country, and refinery operator name, with in-depth coverage of condensate splitter units capacity for all active and new-build (planned and announced) refineries. The report also provides global and regional capital expenditure outlook by key countries, year on year, till 2026. The report also provides a comparison of key countries based on contribution to global as well as regional condensate splitter unit capacities.

Refinery condensate splitter units market overview

Refinery condensate splitter units market overview

For more insights on this report, download a free report sample

What are the major planned and announced projects in the global refinery condensate splitter units market?

The major planned and announced projects in the global refinery condensate splitter units market are Siraf, Pengerang II, Bandar Abbas III, Darwin, Forcados, Ohaji, Brownsville, Amur, and Ibigwe.

What is the region-level outlook of the global refinery condensate splitter units market?

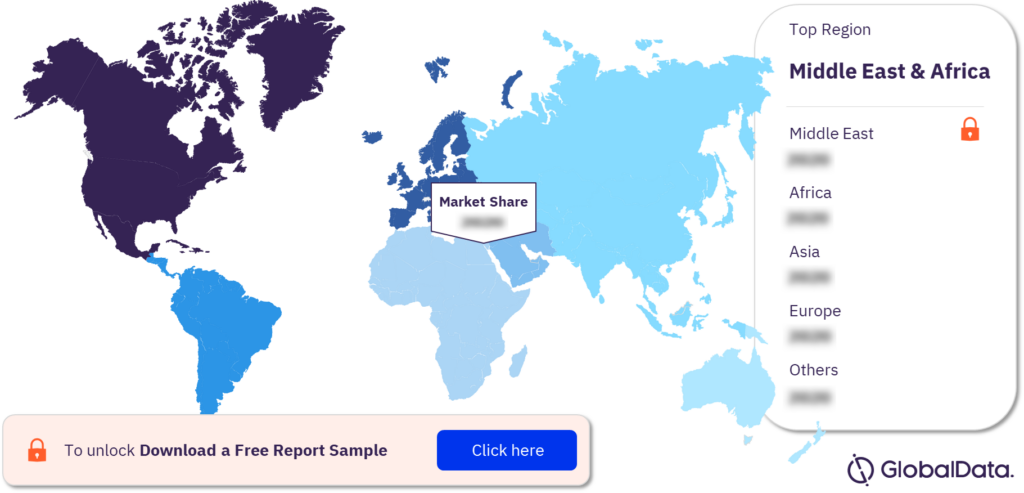
The key regions in the global refinery condensate splitter units market are Africa, Asia, Europe, the Former Soviet Union, the Middle East, North America, and Oceania.

Africa

Algeria and Cameroon are the two countries in Africa that accounted for total condensate splitter units capacity of the region. Skikda II (Algeria) and Limbe (Cameroon) are the two refineries with condensate splitter units.

Asia

South Korea, China, Thailand, Singapore, and Indonesia are the key countries in Asia in terms of total condensate splitter units capacity of the region.  Daesan II (South Korea), Daesan I (South Korea), Rayong II (Thailand), Zhangzhou (China), and Incheon (South Korea), are the major refineries with active condensate splitter units.

Europe

The Netherlands and Denmark are the only two countries in Europe that accounted for the total condensate splitter units capacity of the region in 2021. Rotterdam IV (Netherlands) and Kalundborg (Denmark) are the only two refineries with active condensate splitter units.

The Former Soviet Union

Russia, Uzbekistan, Kazakhstan, Ukraine and Kyrgyzstan are the five countries in the FSU that accounted for total condensate splitter units capacity of the region in 2021. Ust-Luga (Russia), Bukhara (Uzbekistan), Nizhnekamsk I (Russia), Karachaganak (Kazakhstan), and Shebelinka I (Ukraine) and are the major refineries with condensate splitter units.

Middle East

The UAE, Iran, Qatar, and Saudi Arabia are the only countries in the Middle East that accounted for total condensate splitter units capacity. Bandar Abbas II (Iran), Ruwais (United Arab Emirates), Ras Tanura (Saudi Arabia), Jebel Ali (United Arab Emirates), and Laffan I (Qatar) are the major refineries with active condensate splitter units in the region.

North America

Gulf Coast, Midwest, and Canada are the key countries and areas in North America that accounted for total condensate splitter units capacity. Galena Park (US), Port Arthur III (US), Corpus Christi V (US), Corpus Christi VI (US), and Channelview II are the major refineries with active condensate splitter units in the region. 

Oceania

Darwin is the major refinery in the region.

Global refinery condensate splitter units market analysis by regions

Global refinery condensate splitter units market analysis by regions

For more region insights, download a free report sample

Market report scope

Market volume (2021) 4,185 mbd
AAGR (2021 to 2026) >4%
Forecast period 2022-2026
Key regions Africa, Asia, Europe, the Former Soviet Union, the Middle East, North America, and Oceania

This report provides:

  • Updated information on all active and upcoming refinery condensate splitter units globally.
  • Provides key details such as refinery name, operator name, and status for all active, suspended, planned, and announced refinery condensate splitter units in a country.
  • Provides an annual breakdown of new build and expansion capital expenditure outlook by region and by key countries for the period 2022–2026.

Reasons to Buy

  • Obtain the most up to date information available on all active, suspended, planned, and announced refinery condensate splitter units globally.
  • Identify growth segments and opportunities in the refinery condensate splitter units industry.
  • Facilitate decision-making on the basis of strong refinery condensate splitter units capacity data.
  • Assess your competitor’s refinery condensate splitter units portfolio.

Table of Contents

| About GlobalData 2

1 Introduction 10

1.1. What is this Report About? 10

1.2. Market Definition 10

2 Global Refinery Condensate Splitter Units, Snapshot 11

2.1. Global Refinery Condensate Splitter Units, Key Data, 2021 11

2.2. Global Refinery Condensate Splitter Units, Planned and Announced Condensate Splitter Units 13

2.3. Global Refinery Condensate Splitter Units, New Condensate Splitter Units and Capacity Expansions by Region 16

2.4. Global Refinery Condensate Splitter Units, Regional Comparisons 18

3 Africa Refinery Condensate Splitter Units 19

3.1. Africa Refinery Condensate Splitter Units, Snapshot 19

3.2. Africa Refinery Condensate Splitter Units, Planned and Announced Condensate Splitter Units, Capacity Expansions and Capex by Country 21

3.3. Africa Refinery Condensate Splitter Units, New Condensate Splitter Units and Capacity Expansions by Key Countries 24

3.4. Africa Refinery Condensate Splitter Units, Algeria 25

3.5. Africa Refinery Condensate Splitter Units, Cameroon 25

3.6. Africa Refinery Condensate Splitter Units, Nigeria 26

3.7. Africa Refinery Condensate Splitter Units, Equatorial Guinea 26

4 Asia Refinery Condensate Splitter Units 27

4.1. Asia Refinery Condensate Splitter Units, Snapshot 27

4.2. Asia Refinery Condensate Splitter Units, Planned and Announced Condensate Splitter Units, Capacity Expansions and Capex by Country 29

4.3. Asia Refinery Condensate Splitter Units, New Condensate Splitter Units and Capacity Expansions by Key Countries 32

4.4. Asia Refinery Condensate Splitter Units, South Korea 33

4.5. Asia Refinery Condensate Splitter Units, China 34

4.6. Asia Refinery Condensate Splitter Units, Thailand 35

4.7. Asia Refinery Condensate Splitter Units, Singapore 35

4.8. Asia Refinery Condensate Splitter Units, Indonesia 36

4.9. Asia Refinery Condensate Splitter Units, Malaysia 36

4.10. Asia Refinery Condensate Splitter Units, Taiwan 37

4.11. Asia Refinery Condensate Splitter Units, Japan 37

4.12. Asia Refinery Condensate Splitter Units, Vietnam 38

4.13. Asia Refinery Condensate Splitter Units, Bangladesh 39

4.14. Asia Refinery Condensate Splitter Units, Pakistan 40

5 Europe Refinery Condensate Splitter Units 41

5.1. Europe Refinery Condensate Splitter Units, Snapshot 41

5.2. Europe Refinery Condensate Splitter Units, Netherlands 43

5.3. Europe Refinery Condensate Splitter Units, Denmark 43

6 Former Soviet Union Refinery Condensate Splitter Units 44

6.1. Former Soviet Union Refinery Condensate Splitter Units, Snapshot 44

6.2. FSU Refinery Condensate Splitter Units, Planned and Announced Condensate Splitter Units, Capacity Expansions and Capex by Country 46

6.3. FSU Refinery Condensate Splitter Units, New Condensate Splitter Units and Capacity Expansions by Key Countries 49

6.4. FSU Refinery Condensate Splitter Units, Russia 50

6.5. FSU Refinery Condensate Splitter Units, Uzbekistan 50

6.6. FSU Refinery Condensate Splitter Units, Kazakhstan 51

6.7. FSU Refinery Condensate Splitter Units, Ukraine 51

6.8. FSU Refinery Condensate Splitter Units, Kyrgyzstan 52

7 Middle East Refinery Condensate Splitter Units 53

7.1. Middle East Refinery Condensate Splitter Units, Snapshot 53

7.2. Middle East Refinery Condensate Splitter Units, Planned and Announced Condensate Splitter Units, Capacity Expansions and Capex by Country 55

7.3. Middle East Refinery Condensate Splitter Units, New Condensate Splitter Units and Capacity Expansions by Country 58

7.4. Middle East Refinery Condensate Splitter Units, United Arab Emirates 59

7.5. Middle East Refinery Condensate Splitter Units, Iran 60

7.6. Middle East Refinery Condensate Splitter Units, Qatar 61

7.7. Middle East Refinery Condensate Splitter Units, Saudi Arabia 61

8 North America Refinery Condensate Splitter Units 62

8.1. North America Refinery Condensate Splitter Units, Snapshot 62

8.2. North America Refinery Condensate Splitter Units, Planned and Announced Condensate Splitter Units, Capacity Expansions and Capex by Country 64

8.3. North America Refinery Condensate Splitter Units, New Condensate Splitter Units and Capacity Expansions by Country 67

8.4. Refinery Condensate Splitter Units in the US, Gulf Coast (PADD 3) 68

8.5. Refinery Condensate Splitter Units in the US, Midwest (PADD 2) 69

8.6. Refinery Condensate Splitter Units in Canada 69

9 Oceania Refinery Condensate Splitter Units 70

9.1. Oceania Refinery Condensate Splitter Units, Planned and Announced Condensate Splitter Units, Capacity Expansions and Capex by Country 70

9.2. Oceania Refinery Condensate Splitter Units, New Condensate Splitter Units and Capacity Expansions by Country 73

9.3. Oceania Refinery Condensate Splitter Units, Australia 74

10 Appendix 75

10.1. Abbreviations 75

10.2. Status Definition 75

10.3. States by PADD Regions Included in the Report 75

10.4. Methodology 75

| Contact Us 77

Table

Table 1: Refinery condensate splitter units, Global, key statistics, 2021 11

Table 2: Refinery condensate splitter units, Global, capacity by key countries (mbd), 2016–2026 11

Table 3: Refinery condensate splitter units, Global, top 10 planned and announced condensate splitter units details, 2022–2026 13

Table 4: Global, annual new build and expansion capital expenditure for condensate splitter units ($M), 2022–2026 14

Table 5: Refinery condensate splitter units, Global, annual new build and expansion capital expenditure outlook for condensate splitter units by country ($M), 2022–2026 15

Table 6: Refinery condensate splitter units, Global, condensate splitter units capacity additions through new and existing refinery expansions by region (mbd), 2022–2026 16

Table 7: Refinery condensate splitter units, Global, condensate splitter units capacity additions through new refineries by region (mbd), 2022–2026 16

Table 8: Refinery condensate splitter units, Global, condensate splitter units capacity additions through existing refinery expansions by region (mbd), 2022–2026 17

Table 9: Refinery condensate splitter units, regional comparison, contribution (%) to Global condensate splitter units capacity, 2016–2026 18

Table 10: Refinery condensate splitter units, Africa, key statistics, 2021 19

Table 11: Refinery condensate splitter units, Africa, capacity by country (mbd), 2016–2026 20

Table 12: Refinery condensate splitter units, Africa, planned and announced condensate splitter units details, 2022–2026 21

Table 13: Refinery condensate splitter units, Africa, annual new build and expansion capital expenditure outlook for condensate splitter units ($M), 2022–2026 22

Table 14: Africa, annual new build and expansion capital expenditure outlook for condensate splitter units by country ($M), 2022–2026 23

Table 15: Refinery condensate splitter units, Africa, condensate splitter units capacity additions through new and existing refinery expansions by country (mbd), 2022–2026 24

Table 16: Refinery condensate splitter units, Africa, condensate splitter units capacity additions through new refineries by country (mbd), 2022–2026 24

Table 17: Refinery condensate splitter units, Africa, condensate splitter units capacity additions through existing refinery expansions by country (mbd), 2022–2026 24

Table 18: Refinery condensate splitter units, Algeria, condensate splitter unit capacity (mbd), 2016–2026 25

Table 19: Refinery condensate splitter units, Cameroon, condensate splitter unit capacity (mbd), 2016–2026 25

Table 20: Refinery condensate splitter units, Nigeria, condensate splitter unit capacity (mbd), 2016–2026 26

Table 21: Refinery condensate splitter units, Equatorial Guinea, condensate splitter unit capacity (mbd), 2016–2026 26

Table 22: Refinery condensate splitter units, Asia, key statistics, 2021 27

Table 23: Refinery condensate splitter units, Asia, capacity by key countries (mbd), 2016–2026 28

Table 24: Refinery condensate splitter units, Asia, planned and announced condensate splitter units details, 2022–2026 29

Table 25: Refinery condensate splitter units, Asia, annual new build capital expenditure outlook for condensate splitter units ($M), 2022–2026 30

Table 26: Asia, annual new build capital expenditure outlook for condensate splitter units by country ($M), 2022–2026 31

Table 27: Refinery condensate splitter units, Asia, condensate splitter units capacity additions through new refineries by country (mbd), 2022–2026 32

Table 28: Refinery condensate splitter units, South Korea, condensate splitter unit capacity (mbd), 2016–2026 33

Table 29: Refinery condensate splitter units, China, condensate splitter unit capacity (mbd), 2016–2026 34

Table 30: Refinery condensate splitter units, Thailand, condensate splitter unit capacity (mbd), 2016–2026 35

Table 31: Refinery condensate splitter units, Singapore, condensate splitter unit capacity (mbd), 2016–2026 35

Table 32: Refinery condensate splitter units, Indonesia, condensate splitter unit capacity (mbd), 2016–2026 36

Table 33: Refinery condensate splitter units, Malaysia, condensate splitter unit capacity (mbd), 2016–2026 36

Table 34: Refinery condensate splitter units, Taiwan, condensate splitter unit capacity (mbd), 2016–2026 37

Table 35: Refinery condensate splitter units, Japan, condensate splitter unit capacity (mbd), 2016–2026 37

Table 36: Refinery condensate splitter units, Vietnam, condensate splitter unit capacity (mbd), 2016–2026 38

Table 37: Refinery condensate splitter units, Bangladesh, condensate splitter unit capacity (mbd), 2016–2026 39

Table 38: Refinery condensate splitter units, Pakistan, condensate splitter unit capacity (mbd), 2016–2026 40

Table 39: Refinery condensate splitter units, Europe, key statistics, 2021 41

Table 40: Refinery condensate splitter units, Europe, capacity by country (mbd), 2016–2026 42

Table 41: Refinery condensate splitter units, Netherlands, condensate splitter unit capacity (mbd), 2016–2026 43

Table 42: Refinery condensate splitter units, Denmark, condensate splitter unit capacity (mbd), 2016–2026 43

Table 43: Refinery condensate splitter units, Former Soviet Union, key statistics, 2021 44

Table 44: Refinery condensate splitter units, FSU, capacity by countries (mbd), 2016–2026 45

Table 45: Refinery condensate splitter units, FSU, planned and announced condensate splitter units details, 2022–2026 46

Table 46: Refinery condensate splitter units, FSU, annual new build capital expenditure outlook for condensate splitter units ($M), 2022–2026 47

Table 47: FSU, annual new build capital expenditure outlook for condensate splitter units by country ($M), 2022–2026 48

Table 48: Refinery condensate splitter units, FSU, condensate splitter units capacity additions through new refineries by country (mbd), 2022–2026 49

Table 49: Refinery condensate splitter units, Russia, condensate splitter unit capacity (mbd), 2016–2026 50

Table 50: Refinery condensate splitter units, Uzbekistan, condensate splitter unit capacity (mbd), 2016–2026 50

Table 51: Refinery condensate splitter units, Kazakhstan, condensate splitter unit capacity (mbd), 2016–2026 51

Table 52: Refinery condensate splitter units, Ukraine, condensate splitter unit capacity (mbd), 2016–2026 51

Table 53: Refinery condensate splitter units, Kyrgyzstan, condensate splitter unit capacity (mbd), 2016–2026 52

Table 54: Refinery condensate splitter units, Middle East, key statistics, 2021 53

Table 55: Refinery condensate splitter units, Middle East, capacity by country (mbd), 2016–2026 54

Table 56: Refinery condensate splitter units, Middle East, planned and announced condensate splitter units details, 2022–2026 55

Table 57: Refinery condensate splitter units, Middle East, annual new build capital expenditure outlook for condensate splitter units ($M), 2022–2026 56

Table 58: Middle East, annual new build capital expenditure outlook for condensate splitter units by country ($M), 2022–2026 57

Table 59: Refinery condensate splitter units, Middle East, condensate splitter units capacity additions through new refineries by country (mbd), 2022–2026 58

Table 60: Refinery condensate splitter units, United Arab Emirates, condensate splitter unit capacity (mbd), 2016–2026 59

Table 61: Refinery condensate splitter units, Iran, condensate splitter unit capacity (mbd), 2016–2026 60

Table 62: Refinery condensate splitter units, Qatar, condensate splitter unit capacity (mbd), 2016–2026 61

Table 63: Refinery condensate splitter units, Saudi Arabia, condensate splitter unit capacity (mbd), 2016–2026 61

Table 64: Refinery condensate splitter units, North America, key statistics, 2021 62

Table 65: Refinery condensate splitter units, North America, capacity by US PADD Regions and Canada (mbd), 2016–2026 63

Table 66: Refinery condensate splitter units, North America, planned and announced condensate splitter units details, 2022–2026 64

Table 67: Refinery condensate splitter units, North America, annual new build capital expenditure outlook for condensate splitter units ($M), 2022–2026 65

Table 68: North America, annual new build capital expenditure outlook for condensate splitter units by country ($M), 2022–2026 66

Table 69: Refinery condensate splitter units, North America, condensate splitter units capacity additions through new refineries by country (mbd), 2022–2026 67

Table 70: Refinery condensate splitter units, Gulf Coast, condensate splitter unit capacity (mbd), 2016–2026 68

Table 71: Refinery condensate splitter units, Midwest, condensate splitter unit capacity (mbd), 2016–2026 69

Table 72: Refinery condensate splitter units, Canada, condensate splitter unit capacity (mbd), 2016–2026 69

Table 73: Refinery condensate splitter units, Oceania, planned and announced condensate splitter units details, 2022–2026 70

Table 74: Refinery condensate splitter units, Oceania, annual new build capital expenditure outlook for condensate splitter units ($M), 2022–2026 71

Table 75: Oceania, annual new build capital expenditure outlook for condensate splitter units by country ($M), 2022–2026 72

Table 76: Refinery condensate splitter units, Oceania, condensate splitter units capacity additions through new refineries by country (mbd), 2022–2026 73

Table 77: Refinery condensate splitter units, Australia, condensate splitter unit capacity (mbd), 2016–2026 74

Figures

Figure 1: Refinery condensate splitter units, Global, capacity market share vis-à-vis growth by key countries, 2016–2021 12

Figure 2: Refinery condensate splitter units, Global, annual new build and expansion capital expenditure outlook for condensate splitter units ($M), 2022–2026 14

Figure 3: Global, annual new build and expansion capital expenditure outlook for condensate splitter units by country ($M), 2022–2026 15

Figure 4: Refinery condensate splitter units, regional comparison, contribution (%) to Global condensate splitter units capacity, 2016–2026 18

Figure 5: Refinery condensate splitter units, Africa, capacity market share vis-à-vis growth by country, 2016–2021 20

Figure 6: Refinery condensate splitter units, Africa, annual new build and expansion capital expenditure outlook for condensate splitter units ($M), 2022–2026 22

Figure 7: Africa, annual new build and expansion capital expenditure outlook for condensate splitter units by country ($M), 2022–2026 23

Figure 8: Refinery condensate splitter units, Asia, capacity market share vis-à-vis growth by key countries, 2016–2021 28

Figure 9: Refinery condensate splitter units, Asia, annual new build capital expenditure outlook for condensate splitter units ($M), 2022–2026 30

Figure 10: Asia, annual new build capital expenditure outlook for condensate splitter units by country ($M), 2022–2026 31

Figure 11: Refinery condensate splitter units, Europe, capacity market share vis-à-vis growth by country, 2016–2021 42

Figure 12: Refinery condensate splitter units, FSU, capacity market share vis-à-vis growth by countries, 2016–2021 45

Figure 13: Refinery condensate splitter units, FSU, annual new build capital expenditure outlook for condensate splitter units ($M), 2022–2026 47

Figure 14: FSU, annual new build capital expenditure outlook for condensate splitter units by country ($M), 2022–2026 48

Figure 15: Refinery condensate splitter units, Middle East, capacity market share vis-à-vis growth by country, 2016–2021 54

Figure 16: Refinery condensate splitter units, Middle East, annual new build capital expenditure outlook for condensate splitter units ($M), 2022–2026 56

Figure 17: Middle East, annual new build capital expenditure outlook for condensate splitter units by country ($M), 2022–2026 57

Figure 18: Refinery condensate splitter units, North America, capacity market share vis-à-vis growth by US PADD regions, 2016–2021 63

Figure 19: Refinery condensate splitter units, North America, annual new build capital expenditure outlook for condensate splitter units ($M), 2022–2026 65

Figure 20: North America, annual new build capital expenditure outlook for condensate splitter units by country ($M), 2022–2026 66

Figure 21: Refinery condensate splitter units, Oceania, annual new build capital expenditure outlook for condensate splitter units ($M), 2022–2026 71

Figure 22: Oceania, annual new build capital expenditure outlook for condensate splitter units by country ($M), 2022–2026 72

Frequently asked questions

Refinery Condensate Splitter Units Market Installed Capacity and Capital Expenditure (CapEx) Forecast by Region and Countries including details of All Active Plants, Planned and Announced Projects, 2022-2026 thematic reports
Currency USD
$5,000

Can be used by individual purchaser only

$15,000

Can be shared globally by unlimited users within the purchasing corporation e.g. all employees of a single company


Undecided about purchasing this report?

Enquire Before Buying Request a Free Sample

Get in touch to find out about multi-purchase discounts

reportstore@globaldata.com
Tel +44 20 7947 2745

Every customer’s requirement is unique. With over 220,000 construction projects tracked, we can create a tailored dataset for you based on the types of projects you are looking for. Please get in touch with your specific requirements and we can send you a quote.

Sample Report

Refinery Condensate Splitter Units Market Installed Capacity and Capital Expenditure (CapEx) Forecast by Region and Countries including details of All Active Plants, Planned and Announced Projects, 2022-2026 was curated by the best experts in the industry and we are confident about its unique quality. However, we want you to make the most beneficial decision for your business, so we offer free sample pages to help you:

  • Assess the relevance of the report
  • Evaluate the quality of the report
  • Justify the cost

Download your copy of the sample report and make an informed decision about whether the full report will provide you with the insights and information you need.

Below is a sample report to understand what you are buying

See what our customers are saying

“The GlobalData platform is our go-to tool for intelligence services. GlobalData provides an easy way to access comprehensive intelligence data around multiple sectors, which essentially makes it a one-for-all intelligence platform, for tendering and approaching customers.

GlobalData is very customer orientated, with a high degree of personalised services, which benefits everyday use. The highly detailed project intelligence and forecast reports can be utilised across multiple departments and workflow scopes, from operational to strategic level, and often support strategic decisions. GlobalData Analytics and visualisation solutions has contributed positively when preparing management presentations and strategic papers.”

Business Intelligence & Marketing Manager, SAL Heavy Lift

“COVID-19 has caused significant interference to our business and the COVID-19 intelligence from GlobalData has helped us reach better decisions around strategy. These two highlights have helped enormously to understand the projections into the future concerning our business units, we also utilise the project database to source new projects for Liebherr-Werk to use as an additional source to pitch for new business.”

Market Analyst & Management, Liebherr-Werk

Your daily news has saved me a lot of time and keeps me up-to-date with what is happening in the market, I like that you almost always have a link to the source origin. We also use your market data in our Strategic Business Process to support our business decisions. By having everything in one place on the Intelligence Center it has saved me a lot of time versus looking on different sources, the alert function also helps with this.

Head of Key Accounts, Saab AB

Having used several other market research companies, I find that GlobalData manages to provide that ‘difficult-to-get’ market data that others can’t, as well as very diverse and complete consumer surveys.

Marketing Intelligence Manager, Portugal Foods

Our experience with GlobalData has been very good, from the platform itself to the people. I find that the analysts and the account team have a high level of customer focus and responsiveness and therefore I can always rely on. The platform is more holistic than other providers. It is convenient and almost like a one stop shop. The pricing suite is highly competitive and value for our organisation.

I like reports that inform new segments such as the analysis on generation Z, millennials, the impact of COVID 19 to our banking customers and their new channel habits. Secondly the specialist insight on affluent sector significantly increases our understanding about this group of customers. The combination of those give us depth and breadth of the evolving market.

I’m in the business of answering and helping people make decisions so with the intelligence center I can do that, effectively and efficiently. I can share quickly key insights that answer and satisfy our country stakeholders by giving them many quality studies and primary research about competitive landscape beyond the outlook of our bank. It helps me be seen as an advisory partner and that makes a big difference. A big benefit of our subscription is that no one holds the whole data and because it allows so many people, so many different parts of our organisation have access, it enables all teams to have the same level of knowledge and decision support.

Head of Customer Insight and Research, Standard Chartered

“I know that I can always rely on Globaldata’s work when I’m searching for the right consumer and market insights. I use Globaldata insights to understand the changing market & consumer landscape and help create better taste & wellbeing solutions for our customers in food, beverage and healthcare industries.

Globaldata has the right data and the reports are of very high quality compared to your competitors. Globaldata not only has overall market sizes & consumer insights on food & beverages but also provides insights at the ingredient & flavour level. That is key for B2B companies like Givaudan. This way we understand our customers’ business and also gain insight to our unique industry”

Head of Consumer Sensory Insights, Givaudan

GlobalData provides a great range of information and reports on various sectors that is highly relevant, timely, easy to access and utilise.  The reports and data dashboards help engagement with clients; they provide valuable industry and market insights that can enrich client conversations and can help in the shaping of value propositions. Moreover, using GlobalData products has helped increase my knowledge of the finance sector, the players within it, and the general threats and opportunities.

I find the consumer surveys that are carried out to be extremely beneficial and not something I have seen anywhere else. They provided an insightful view of why and which consumers take (or don’t) particular financial products. This can help shape conversations with clients to ensure they make the right strategic decisions for their business.

One of the challenges I have found is that data in the payments space is often piecemeal. With GD all of the data I need is in one place, but it also comes with additional market reports that provide useful extra context and information. Having the ability to set-up alerts on relevant movements in the industry, be it competitors or customers, and have them emailed directly to me, ensures I get early sight of industry activity and don’t have to search for news.

Senior Account Manager, TSYS
Go even deeper with GlobalData Intelligence Center

Every Company Report we produce is powered by the GlobalData Intelligence Center.

Subscribing to our intelligence platform means you can monitor developments at Refinery Condensate Splitter Units Market Installed Capacity and Capital Expenditure (CapEx) Forecast by Region and Countries including details of All Active Plants, Planned and Announced Projects, 2022-2026 in real time.

  • Access a live Refinery Condensate Splitter Units Market Installed Capacity and Capital Expenditure (CapEx) Forecast by Region and Countries including details of All Active Plants, Planned and Announced Projects, 2022-2026 dashboard for 12 months, with up-to-the-minute insights.
  • Fuel your decision making with real-time deal coverage and media activity.
  • Turn insights on financials, deals, products and pipelines into powerful agents of commercial advantage.