Solar Photovoltaic (PV) Market Size, Share and Trends Analysis by Technology, Installed Capacity, Generation, Drivers, Constraints, Key Players and Forecast, 2022-2030

Powered by

All the vital news, analysis, and commentary curated by our industry experts.

Solar Photovoltaic Market Overview

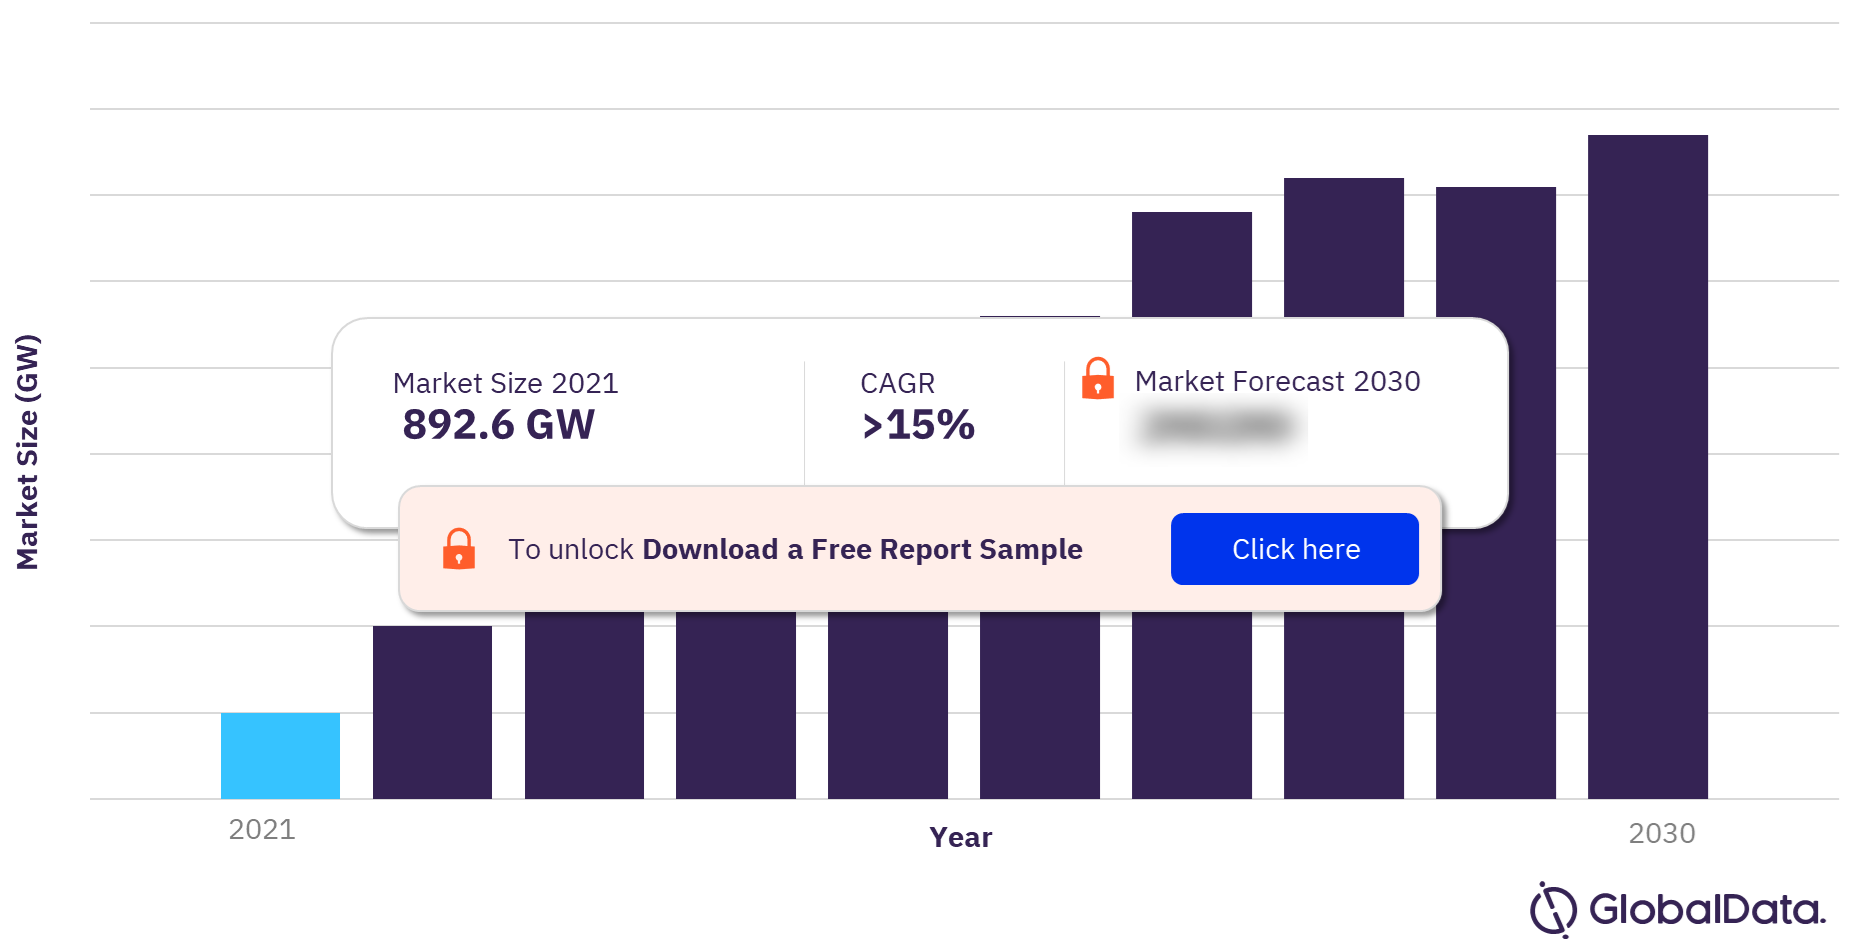
The Solar Photovoltaic (PV) market cumulative installed capacity is 892.6 GW and is expected to achieve a CAGR of more than 15% during 2021-2030. The growing demand for solar energy in residential and commercial applications helps increase PV deployment. The growing need to reduce greenhouse gas (GHG) emissions and the demand for energy due to growing population and modernization are some of the major factors aiding the adoption of solar PV. Regulations at the federal and state levels to provide tax benefit for installing commercial, residential, and utility-driven solar facilities are drawing investors to the solar PV market, thereby driving the market growth positively.

Solar PV Market Outlook, 2021-2030 (GW)

Solar PV Market Outlook

For more insights into the Solar PV market forecast, download a free sample report

The Solar PV report provides a clear overview of and detailed insight into the global Solar PV market. It also provides data and analysis on the historic and forecasts solar PV capacity and generation; the impact of COVID-19 pandemic, geo-political scenario, major active and upcoming plants, market size, and market drivers and challenges for eleven key solar PV market countries – Australia, South Korea, China, France, Germany, India, Italy, Japan, Spain, the United States, and Vietnam.

Market Size (2021)  892.6 GW
CAGR (2021 – 2030)  >15%
Forecast Period 2022-2030
Key Regions North America, Europe, Asia-Pacific, South and Central America, and Middle East & Africa
Key Countries China, The US, India, Japan, Spain, Germany, Italy, South Korea, France, Vietnam, and Australia
Key Sectors Utility Installations, Residential Installations and Commercial Installations
Leading Companies LONGi Solar Technology Co Ltd, Trina Solar Co Ltd, JA Solar Holdings Co Ltd, Jinko Solar Holding Co Ltd, Canadian Solar, Rysen Energy, GCL Solar Energy Technology Holdings Inc. and Shunfeng International

Solar PV Market- Future Opportunities and Trends

Owing to the demand for more economic and sustainable energy sources, solar power companies continue to focus on advancing technologies related to solar cells and extending battery life. The improved solar power and storage technologies could be used to improve the quality of life.

Furthermore, scientists are working on using solar panels to generate energy at night by capturing infrared light, which is produced by the thermal gradient between the solar cell and the atmosphere. The amount of energy produced is way less than the actual production capacity of the solar panel, but it is still an amount of extra energy that could be stored in the power grid for use.

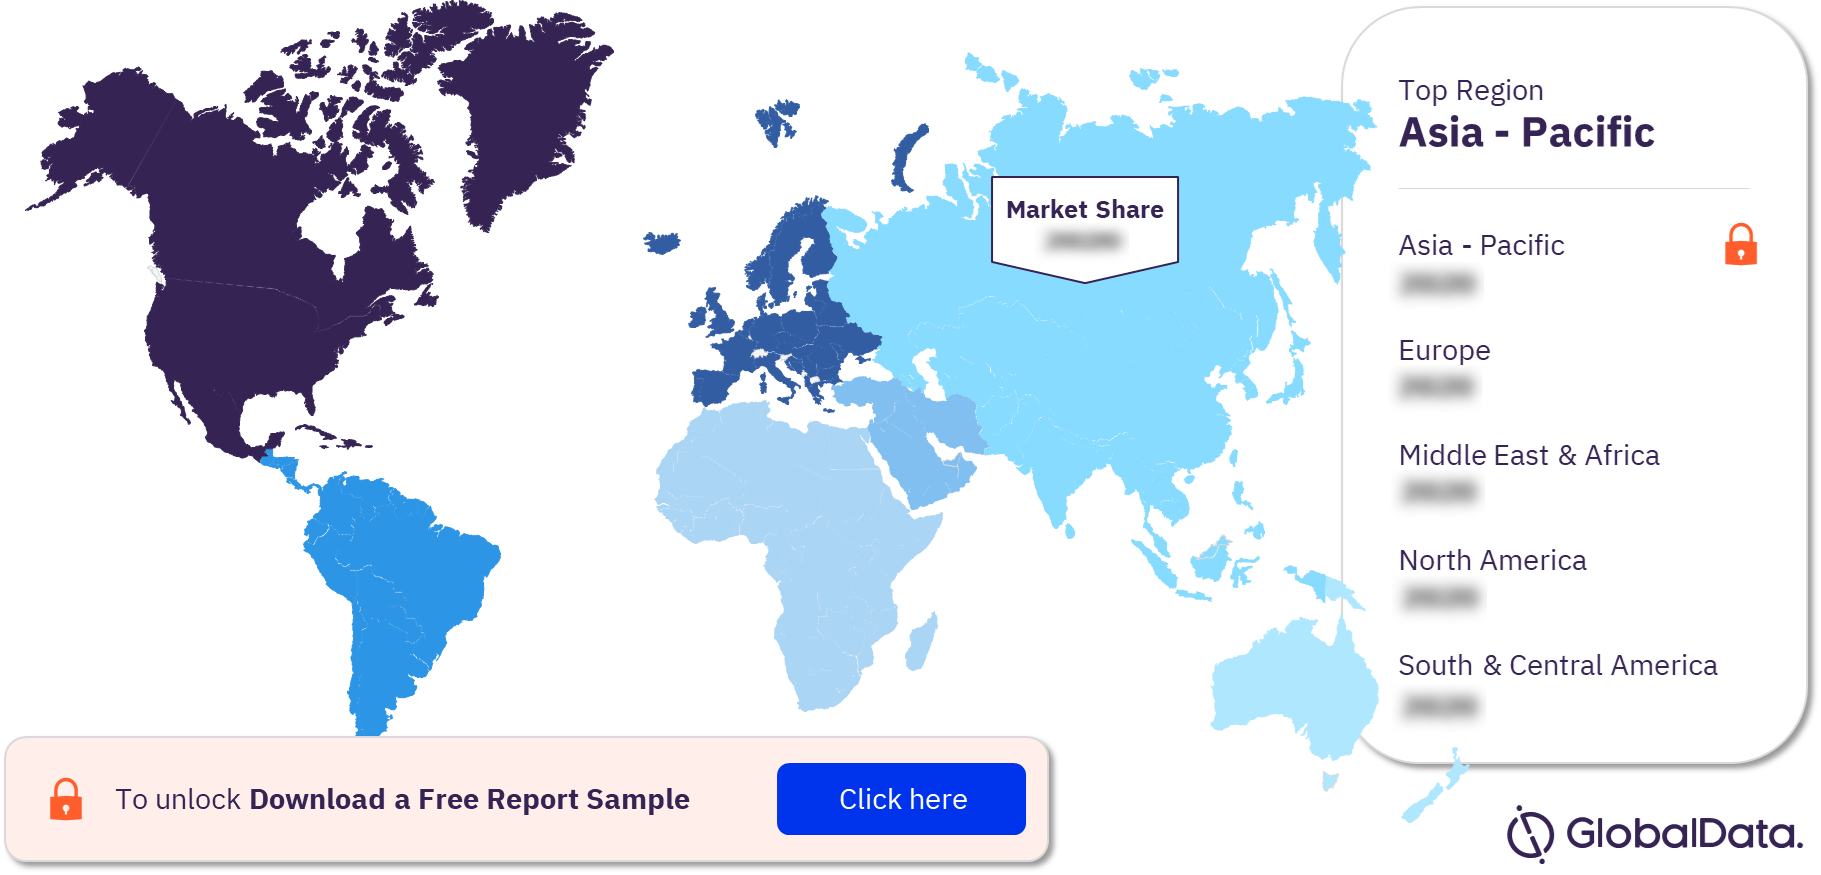
Solar PV Market Segmentation by Region

The key regions in the Solar PV market are North America, Europe, Asia-Pacific, South and Central America, and Middle East & Africa. Asia-Pacific dominated the Solar PV market in terms of cumulative installed capacity in 2021, followed by Europe and North America.

Solar PV Market Analysis by Region, 2021 (%)

Solar PV Market Analysis by Region

For more regional insights into the Solar PV market, download a free sample report

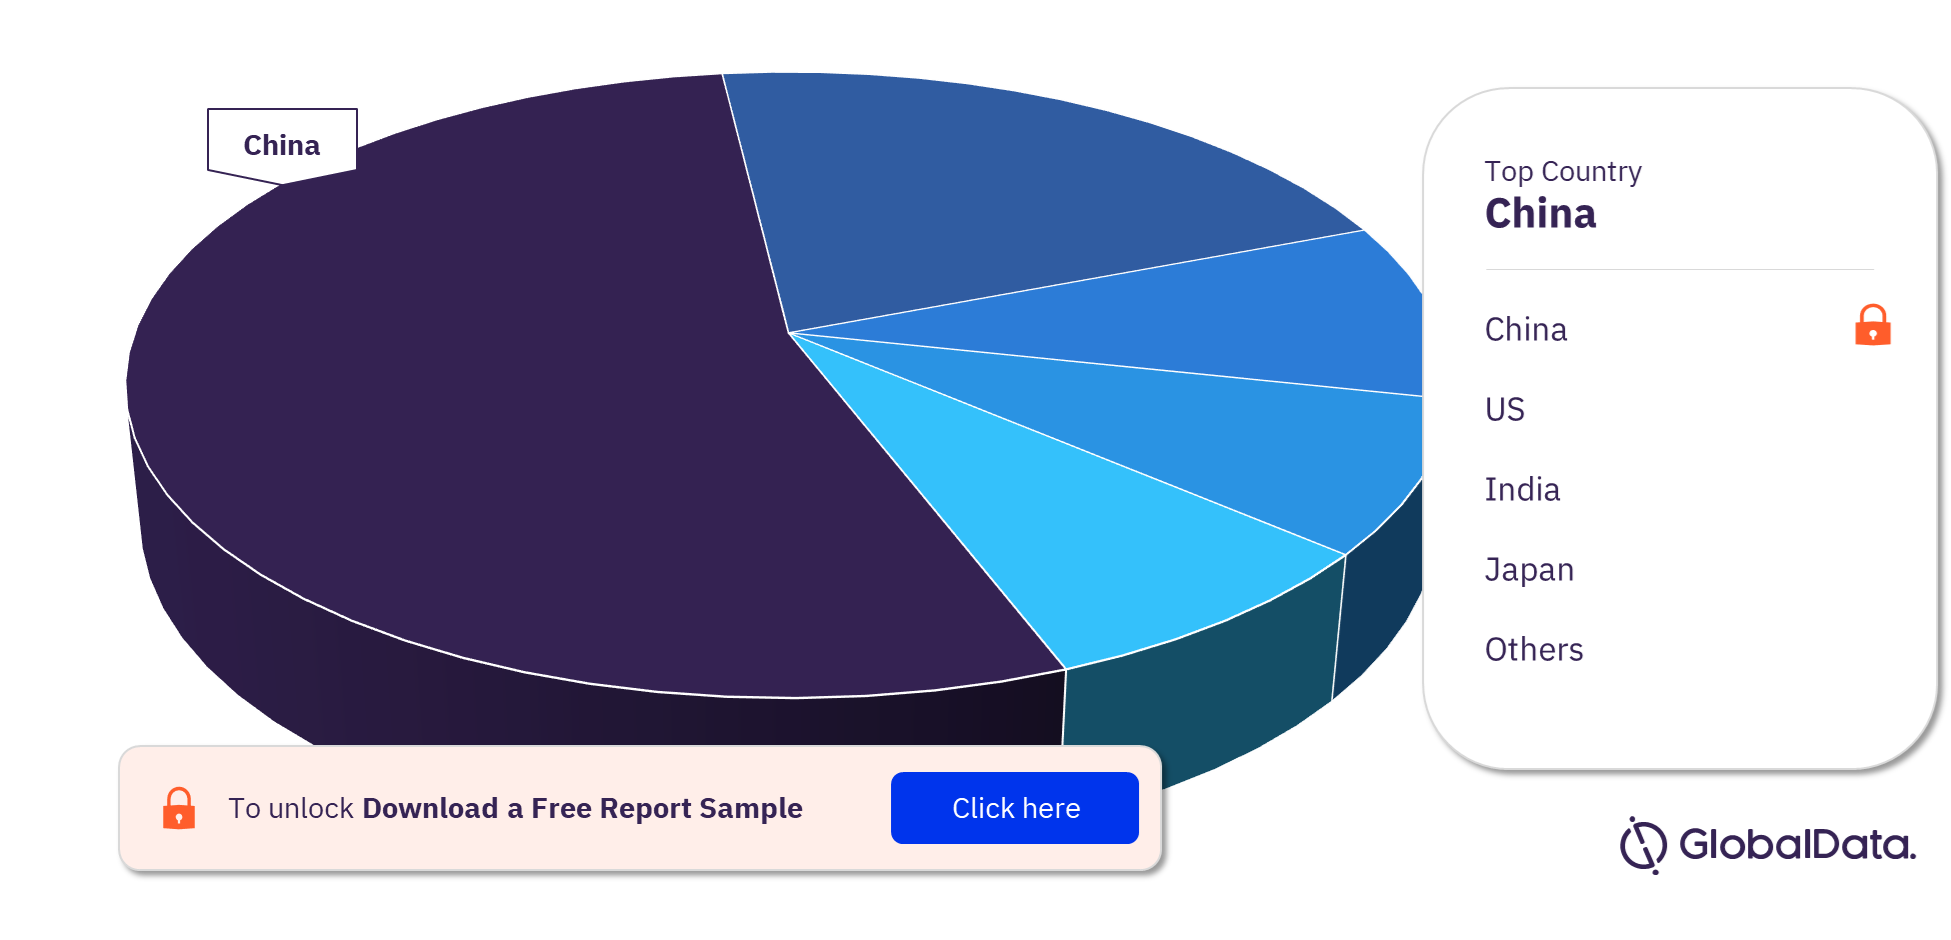
Solar PV Market Segmentation by Countries

The key countries in the Solar PV market are China, the US, India, Japan, Spain, Germany, Italy, South Korea, France, Vietnam, and Australia. China led the Solar PV market in 2021, followed by the US.

Solar PV Market Analysis by Countries, 2021 (%)

Solar PV Market Analysis by Countries

For more country insights into the Solar PV market, download a free sample report

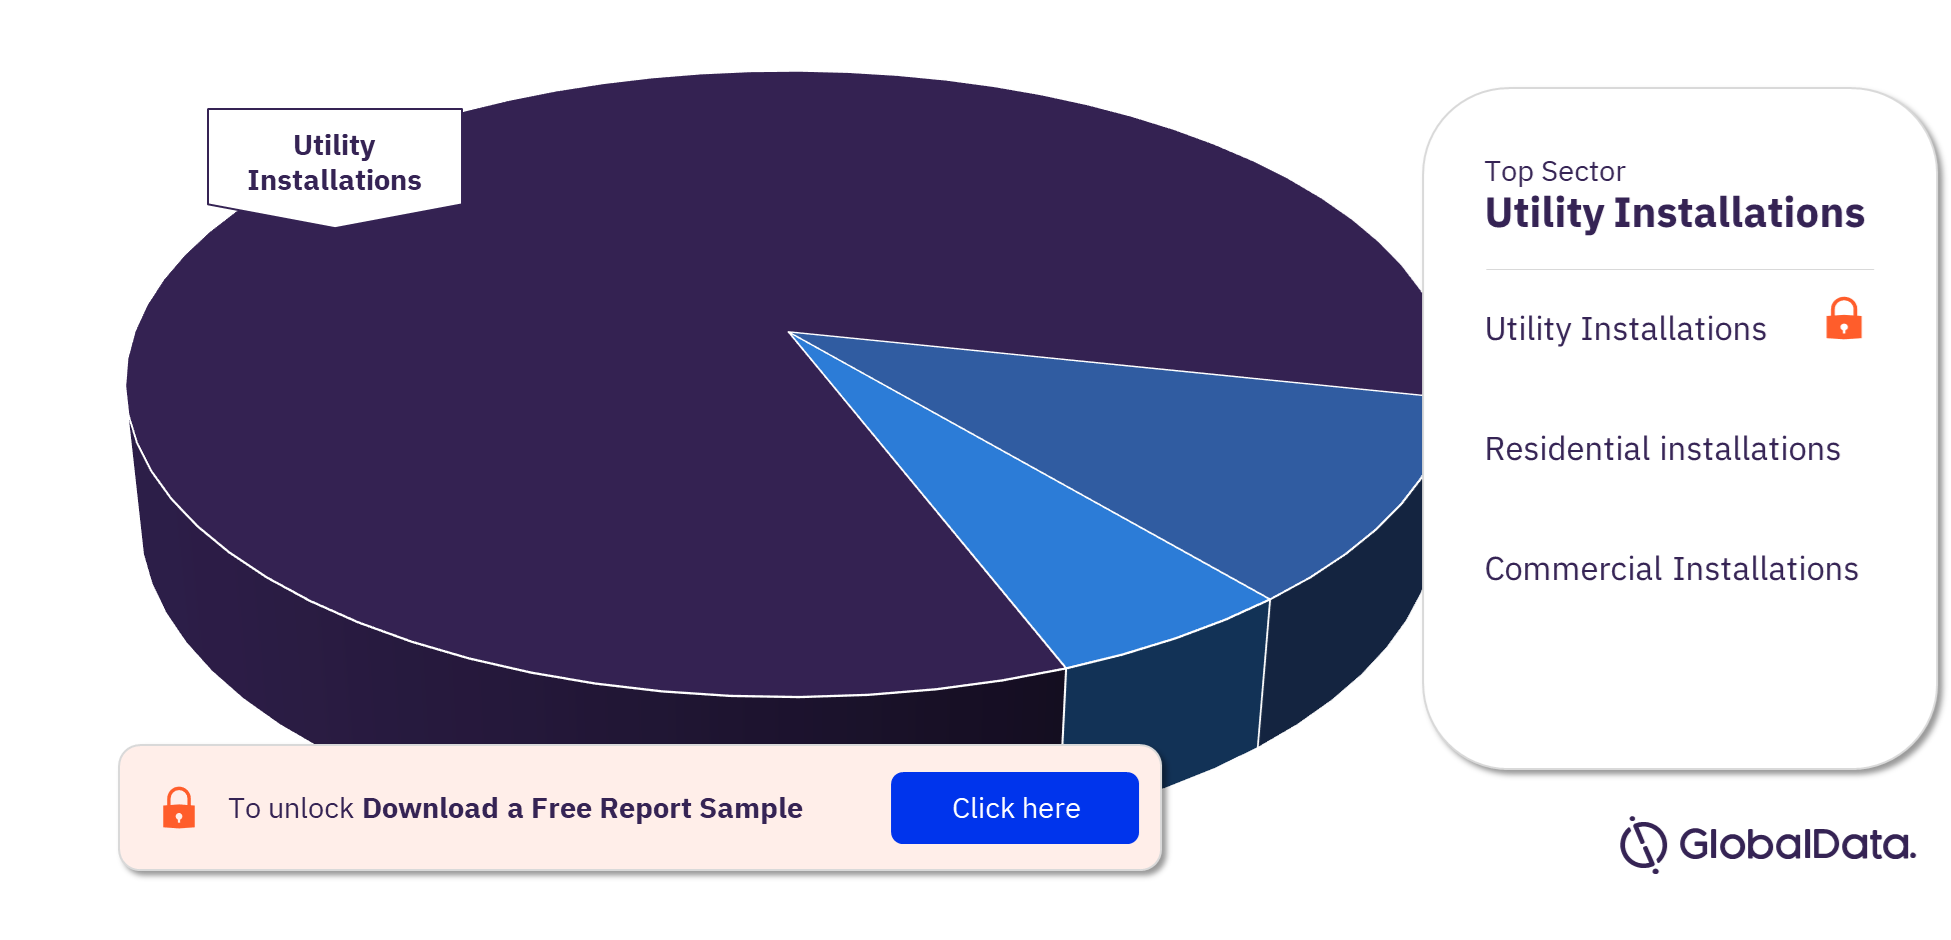
Solar PV Market Segmentation by Sectors

The key sectors in Solar PV market are utility installations, residential installations, and commercial installations. Utility installations led the market in 2021, followed by residential installations.

Solar PV Market Analysis by Sectors, 2021 (%)

Solar PV Market Analysis by Sectors

For more sector insights into the Solar PV market, download a free sample report

Solar PV Market- Competitive Landscape

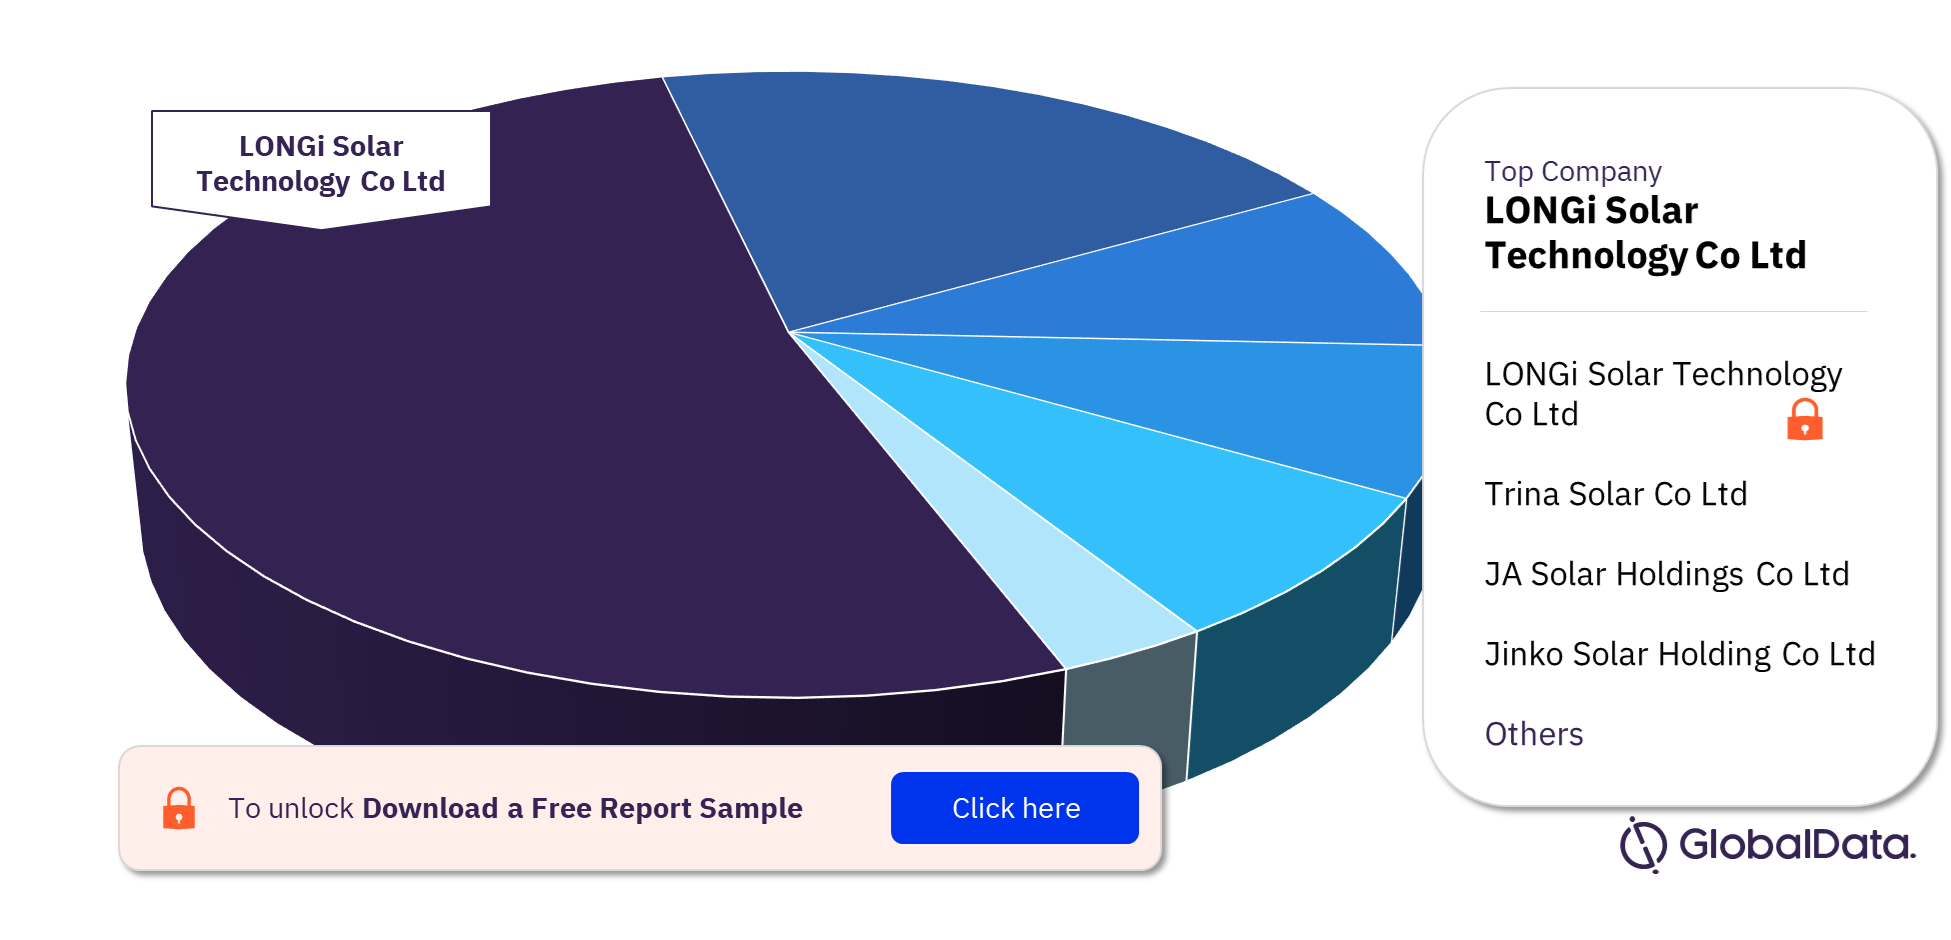
Some of the leaders are LONGi Solar Technology Co Ltd, Trina Solar Co Ltd, JA Solar Holdings Co Ltd, Jinko Solar Holding Co Ltd, Canadian Solar, Rysen Energy, GCL Solar Energy Technology Holdings Inc. and Shunfeng International. LONGi Solar Technology Co Ltd dominated the Solar PV market in 2021, followed by Trina Solar Co Ltd.

Solar PV Market Analysis by Leading Players, 2021 (%)

Solar PV Market Analysis by Leading Players

For more leading company insights into the Solar PV market, download a free sample report

Scope

This report includes:

  • Solar PV market study at the global level, and at a key country level covering eleven key countries in depth.
  • Key growth drivers and challenges at a country level.
  • The impact of the COVID-19 pandemic on the solar PV market at a country level.
  • Historic (2011-2021) and forecast (2022-2030) data for cumulative installed solar PV capacity and generation globally, and for each of the key countries.
  • Market size globally and in each of the key countries.
  • Import and export values in each of the key countries.

Reasons to Buy

The report will allow you to:

  • Facilitate decision-making by providing historical and forecast data in the solar PV market.
  • Develop business strategies by understanding the drivers and challenges of the market.
  • Position yourself to gain the maximum advantage of the industry’s growth potential.
  • Maximize potential in the growth of the solar PV market
  • Identify key partners, geographies, and business-development avenues.
  • Respond to business structure, strategy, and prospects.

LONGi Green Energy Technology
Jinko Solar Co Ltd
Trina Solar Co Ltd
JA Solar Co Ltd
Canadian Solar Inc
Risen Energy Co Ltd
Shunfeng International Clean Energy Ltd
First Solar
Solar Frontier
GCL Solar Energy Technology Holdings Inc.

Table of Contents

About GlobalData

1. Executive Summary

1.1 Global Solar PV Installed Capacity Likely to Reach 3,200.2 GW by 2030

1.2 Asia-Pacific – the largest Solar PV market in 2021

1.3 China remains the largest market in annual and cumulative capacity additions

1.4 Auctions Lead to Most Capacity Additions

1.5 Future opportunities and trends

2. Introduction

2.1 Solar Photovoltaics (PV), Overview

2.2 Types of Solar Modules

– Crystalline Silicon Modules

– Thin-film Technology

2.3 Nature of Solar Installations

– By Grid Connectivity

2.4 Solar PV, Value Chain

2.5 Solar PV, Manufacturing Supply Chain

2.6 GlobalData Report Guidance

3. Solar PV Market, Global

3.1 Solar PV Market, Global, Overview

3.2 Solar PV Market, Global, Installed Capacity, 2011–2030

– Solar PV Market, Global, Installed Capacity by Region, 2021

– Solar PV Market, Global, Installed Capacity by Major Countries, 2021

– Solar PV Market, Global, Annual Capacity Additions By Segment

3.3 Solar PV Market, Global, Generation, 2011–2030

– Solar PV Market, Global, Generation by Region, 2021

– Solar PV Market, Global, Generation by Major Countries, 2021

3.4 Solar PV Market, Global, Market Size, 2011–2030

3.5 Solar PV Market, Global, Number of Jobs, 2012–2021

3.6 Solar PV Market, Global, Module Market Share, 2021

– Solar PV Market, Global, Crystalline Modules’ Market Share, 2021

– Solar PV Market, Global, Thin-Film Modules Market Share, 2021

4. Solar PV Market, the US

4.1 Solar PV Market, the US, Overview

4.2 Solar PV Market, the US, Installed Capacity, 2011–2030

– Solar PV Market, the US, Cumulative Installed Capacity, By State

– Solar PV Market, the US, Annual Capacity Addition, By State

– Solar PV Market, the US, Annual Capacity Addition By Segment

4.3 Solar PV Market, the US, Electricity Generation, 2011–2030

– Solar PV Market, the US, Electricity Generation, By State

4.4 Solar PV Market, the US, Reduction in GHG Emissions, 2011–2030

4.5 Solar PV Market, the US, Major Plants

– Solar PV Market, the US, Major Active Plants

– Solar PV Market, the US, Major Upcoming Plants

4.6 Solar PV Market, the US, Deal Analysis

– Solar PV Market, the US, Deal Value and Size, 2010–2021

– Solar PV Market, the US, Deals by Type, 2021

4.7 Solar PV Market, the US, Number of Jobs, 2010–2021

4.8 Solar PV Market, the US, Market Size, 2011–2030

4.9 Solar PV Market, the US, Imports and Exports, 2010–2021

4.10 Solar PV Market, the US, Drivers, and Challenges

– Solar PV Market, the US, Major Drivers

– Solar PV Market, the US, Major Challenges

4.11 Solar PV Market, the US, Major Manufacturers

4.12 Solar PV Market, the US, Geopolitical Crisis

4.13 Solar PV Market, the US, COVID-19 Impact

5. Solar PV Market, China

5.1 Solar PV Market, China, Overview

5.2 Solar PV Market, China, Installed Capacity, 2011–2030

– Solar PV Market, China, Annual Capacity Additions By Segment

5.3 Solar PV Market, China, Electricity Generation, 2011–2030

5.4 Solar PV Market, China, Reduction in GHG Emissions, 2011–2030

5.5 Solar PV Market, China, Major Plants

– Solar PV Market, China, Major Active Plants

– Solar PV Market, China, Major Upcoming Plants

5.6 Solar PV Market, China, Deal Analysis

– Solar PV Market, China, Deal Value and Volume, 2010–2021

– Solar PV Market, China, Deals by Type, 2021

5.7 Solar PV Market, China, Number of Jobs, 2012–2021

5.8 Solar PV Market, China, Market Size, 2011–2030

5.9 Solar PV Market, China, Imports and Exports, 2010–2021

5.10 Solar PV Market, China, Drivers and Challenges

– Solar PV Market, China, Key Drivers

– Solar PV Market, China, Major Challenges

5.11 Solar PV Market, China, Major Manufacturers

5.12 Solar PV Market, China, Geopolitical Crisis

5.13 Solar PV Market, China, COVID-19 Impact

6. Solar PV Market, India

6.1 Solar PV Market, India, Overview

6.2 Solar PV Market, India, Installed Capacity, 2011–2030

– Solar PV Market, India, Annual Capacity Additions By Segment

6.3 Solar PV Market, India, Electricity Generation, 2011–2030

6.4 Solar PV Market, India, Reduction in GHG Emissions, 2011–2030

6.5 Solar PV Market, India, Major Plants

– Solar PV Market, India, Major Active Plants

– Solar PV Market, India, Major Upcoming Plants

6.6 Solar PV Market, India, Deal Analysis

– Solar PV Market, India, Deal Value and Volume, 2010–2021

– Solar PV Market, India, Deals by Type, 2021

6.7 Solar PV Market, India, Number of Jobs, 2012–2021

6.8 Solar PV Market, India, Market Size, 2011–2030

6.9 Solar PV Market, India, Imports and Exports, 2010–2021

6.10 Solar PV Market, India, Drivers, and Challenges

– Solar PV Market, India, Key Drivers

– Solar PV Market, India, Major Challenges

6.11 Solar PV Market, India, Major Manufacturers

6.12 Solar PV Market, India, Geopolitical Crisis

6.13 Solar PV Market, India, COVID-19 Impact

7. Solar PV Market, Japan

7.1 Solar PV Market, Japan, Overview

7.2 Solar PV Market, Japan, Installed Capacity, 2011–2030

– Solar PV Market, Japan, Annual Capacity Additions By Segment

7.3 Solar PV Market, Japan, Electricity Generation, 2011–2030

7.4 Solar PV Market, Japan, Reduction in GHG Emissions, 2011–2030

7.5 Solar PV Market, Japan, Major Plants

– Solar PV Market, Japan, Major Active Plants

– Solar PV Market, Japan, Major Upcoming Plants

7.6 Solar PV Market, Japan, Deal Analysis

– Solar PV Market, Japan, Deal Value and Volume, 2010–2021

– Solar PV Market, Japan, Deals by Type, 2021

7.7 Solar PV Market, Japan, Number of Jobs, 2014–2021

7.8 Solar PV Market, Japan, Market Size, 2011–2030

7.9 Solar PV Market, Japan, Imports and Exports, 2010–2021

7.10 Solar PV Market, Japan, Drivers, and Challenges

– Solar PV Market, Japan, Key Drivers

– Solar PV Market, Japan, Major Challenges

7.11 Solar PV Market, Japan, Major Manufacturers

7.12 Solar PV Market, Japan, Geopolitical crisis

7.13 Solar PV Market, Japan, COVID-19 Impact

8. Solar PV Market, South Korea

8.1 Solar PV Market, South Korea, Overview

8.2 Solar PV Market, South Korea, Installed Capacity, 2011–2030

– Solar PV Market, South Korea, Annual Capacity Additions by Segment

8.3 Solar PV Market, South Korea, Electricity Generation, 2011–2030

8.4 Solar PV Market, South Korea, Reduction in GHG Emissions, 2011–2030

8.5 Solar PV Market, South Korea, Major Plants

– Solar PV Market, South Korea, Major Active Plants

– Solar PV Market, South Korea, Major Upcoming Plants

8.6 Solar PV Market, South Korea, Deal Analysis

– Solar PV Market, South Korea, Deal Value and Volume, 2010–2021

– Solar PV Market, South Korea, Deals by Type, 2021

8.7 Solar PV Market, South Korea, Number of Jobs, 2015–2021

8.8 Solar PV Market, South Korea, Market Size, 2011–2030

8.9 Solar PV Market, South Korea, Imports and Exports, 2010–2021

8.10 Solar PV Market, South Korea, Drivers and Challenges

– Solar PV Market, South Korea, Key Drivers

– Solar PV Market, South Korea, Major Challenges

8.11 Solar PV Market, South Korea, Major Manufacturers

8.12 Solar PV Market, South Korea, Geopolitical Crisis

8.13 Solar PV Market, South Korea, COVID-19 Impact

9. Solar PV Market, Australia

9.1 Solar PV Market, Australia, Overview

9.2 Solar PV Market, Australia, Installed Capacity, 2011–2030

– Solar PV Market, Australia, Annual Capacity Additions By Segment

9.3 Solar PV Market, Australia, Electricity Generation, 2011–2030

9.4 Solar PV Market, Australia, Reduction in GHG Emissions, 2011–2030

9.5 Solar PV Market, Australia, Major Plants

– Solar PV Market, Australia, Major Active Plants

– Solar PV Market, Australia, Major Upcoming Plants

9.6 Solar PV Market, Australia, Deal Analysis

– Solar PV Market, Australia, Deal Value and Volume, 2010–2021

– Solar PV Market, Australia, Deals by Type, 2021

9.7 Solar PV Market, Australia, Number of Jobs, 2018–2021

9.8 Solar PV Market, Australia, Market Size, 2011–2030

9.9 Solar PV Market, Australia, Imports and Exports, 2010–2021

9.10 Solar PV Market, Australia, Drivers, and Challenges

– Solar PV Market, Australia, Key Drivers

– Solar PV Market, Australia, Major Challenges

9.11 Solar PV Market, Australia, Major Manufacturers

9.12 Solar PV Market, Australia, Geopolitical Crisis

9.13 Solar PV Market, Australia, COVID-19 Impact

10. Solar PV Market, France

10.1 Solar PV Market, France, Overview

10.2 Solar PV Market, France, Installed Capacity, 2011–2030

– Solar PV Market, France, Annual Capacity Additions By Segment

10.3 Solar PV Market, France, Electricity Generation, 2011–2030

10.4 Solar PV Market, France, Reduction in GHG Emissions, 2011–2030

10.5 Solar PV Market, France, Major Plants

– Solar PV Market, France, Major Active Plants

– Solar PV Market, France, Major Upcoming Plants

10.6 Solar PV Market, France, Deal Analysis

– Solar PV Market, France, Deal Value and Volume, 2010–2021

– Solar PV Market, France, Deals by Type, 2021

10.7 Solar PV Market, France, Number of Jobs, 2014–2021

10.8 Solar PV Market, France, Market Size, 2011–2030

10.9 Solar PV Market, France, Imports and Exports, 2010–2021

10.10 Solar PV Market, France, Drivers and Challenges

– Solar PV Market, France, Key Drivers

– Solar PV Market, France, Major Challenges

10.11 Solar PV Market, France, Major Manufacturers

10.12 Solar PV Market, France, Geopolitical Crisis

10.13 Solar PV Market, France, COVID-19 Impact

11. Solar PV Market, Germany

11.1 Solar PV Market, Germany, Overview

11.2 Solar PV Market, Germany, Installed Capacity, 2011–2030

– Solar PV Market, Germany, Annual Capacity Additions By Segment

11.3 Solar PV Market, Germany, Electricity Generation, 2011–2030

11.4 Solar PV Market, Germany, Reduction in GHG Emissions, 2011–2030

11.5 Solar PV Market, Germany, Major Plants

– Solar PV Market, Germany, Major Active Plants

– Solar PV Market, Germany, Major Upcoming Plants

11.6 Solar PV Market, Germany, Deal Analysis

– Solar PV Market, Germany, Deal Value and Volume, 2010–2021

– Solar PV Market, Germany, Deals by Type, 2021

11.7 Solar PV Market, Germany, Number of Jobs, 2011–2021

11.8 Solar PV Market, Germany, Market Size, 2011–2030

11.9 Solar PV Market, Germany, Imports and Exports, 2010–2021

11.10 Solar PV Market, Germany, Drivers and Challenges

– Solar PV Market, Germany, Key Drivers

– Solar PV Market, Germany, Major Challenges

11.11 Solar PV Market, Germany, Major Manufacturers

11.12 Solar PV Market, Germany, Geopolitical Crisis

11.13 Solar PV Market, Germany, COVID-19 Impact

12. Solar PV Market, Italy

12.1 Solar PV Market, Italy, Overview

12.2 Solar PV Market, Italy, Installed Capacity, 2011–2030

– Solar PV Market, Italy, Annual Capacity Additions By Segment

12.3 Solar PV Market, Italy, Electricity Generation, 2011–2030

12.4 Solar PV Market, Italy, Reduction in GHG Emissions, 2011–2030

12.5 Solar PV Market, Italy, Major Plants

– Solar PV Market, Italy, Major Active Plants

– Solar PV Market, Italy, Major Upcoming Plants

12.6 Solar PV Market, Italy, Deal Analysis

– Solar PV Market, Italy, Deal Value and Volume, 2010–2021

– Solar PV Market, Italy, Deals by Type, 2021

12.7 Solar PV Market, Italy, Number of Jobs, 2014–2021

12.8 Solar PV Market, Italy, Market Size, 2011–2030

12.9 Solar PV Market, Italy, Imports and Exports, 2010–2021

12.10 Solar PV Market, Italy, Drivers, and Challenges

– Solar PV Market, Italy, Key Drivers

– Solar PV Market, Italy, Major Challenges

12.11 Solar PV Market, Italy, Major Manufacturers

12.12 Solar PV Market, Italy, Geopolitical Crisis

12.13 Solar PV Market, Italy, COVID-19 Impact

13. Solar PV Market, Spain

13.1 Solar PV Market, Spain, Overview

13.2 Solar PV Market, Spain, Installed Capacity, 2011–2030

– Solar PV Market, Spain, Annual Capacity Additions By Segment

13.3 Solar PV Market, Spain, Electricity Generation, 2011–2030

13.4 Solar PV Market, Spain, Reduction in GHG Emissions, 2011–2030

13.5 Solar PV Market, Spain, Major Plants

– Solar PV Market, Spain, Major Active Plants

– Solar PV Market, Spain, Major Upcoming Plants

13.6 Solar PV Market, Spain, Deal Analysis

– Solar PV Market, Spain, Deal Value and Volume, 2010–2021

– Solar PV Market, Spain, Deals by Type, 2021

13.7 Solar PV Market, Spain, Number of Jobs, 2016–2021

13.8 Solar PV Market, Spain, Market Size, 2011–2030

13.9 Solar PV Market, Spain, Imports and Exports, 2010–2021

13.10 Solar PV Market, Spain, Drivers, and Challenges

– Solar PV Market, Spain, Key Drivers

– Solar PV Market, Spain, Major Challenges

13.11 Solar PV Market, Spain, Major Manufacturers

13.12 Solar PV Market, Spain, Geopolitical Crisis

13.13 Solar PV Market, Spain, COVID-19 Impact

14. Solar PV Market, Vietnam

14.1 Solar PV Market, Vietnam, Overview

14.2 Solar PV Market, Vietnam, Installed Capacity, 2011–2030

– Solar PV Market, Vietnam, Annual Capacity Additions By Segment

14.3 Solar PV Market, Vietnam, Electricity Generation, 2011–2030

14.4 Solar PV Market, Vietnam, Reduction in GHG Emissions, 2011–2030

14.5 Solar PV Market, Vietnam, Major Plants

– Solar PV Market, Vietnam, Major Active Plants

– Solar PV Market, Vietnam, Major Upcoming Plants

14.6 Solar PV Market, Vietnam, Deal Analysis

– Solar PV Market, Vietnam, Deal Value and Volume, 2010–2021

– Solar PV Market, Vietnam, Deals by Type, 2021

14.7 Solar PV Market, Vietnam, Number of Jobs, 2016–2021

14.8 Solar PV Market, Vietnam, Market Size, 2011–2030

14.9 Solar PV Market, Vietnam, Imports and Exports, 2018–2021

14.10 Solar PV Market, Vietnam, Drivers, and Challenges

– Solar PV Market, Vietnam, Key Drivers

– Solar PV Market, Vietnam, Major Challenges

14.11 Solar PV Market, Vietnam, Major Manufacturers

14.12 Solar PV Market, Vietnam, Geopolitical Crisis

14.13 Solar PV Market, Vietnam, COVID-19 Impact

15. Appendix

15.1 Abbreviations

15.2 Bibliography

15.3 Market Definitions

15.4 Methodology

– Coverage

– Secondary Research

– Primary Research

– Modeling and Forecasting

| Contact Us

Table

List of Tables

Table 1: Solar PV Market, Global, Installed Capacity, 2011–2030

Table 2: Solar PV Market, the US, Installed Capacity (GW), 2011–2030

Table 3: Solar PV Market, the US, Major Active Plants

Table 4: Solar PV Market, the US, Major Upcoming Plants

Table 5: Solar PV Market, the US, Major Manufacturers, 2021

Table 6: Solar PV Market, the US, Major Contracts, 2020–2022

Table 7: Solar PV Market, China, Installed Capacity (GW), 2011–2030

Table 8: Solar PV Market, China, Major Active Plants

Table 9: Solar PV Market, China, Major Upcoming Plants

Table 10: Solar PV Market, China, Major Manufacturers, 2020

Table 11: Solar PV Market, China, Major Contracts, 2020–2022

Table 12: Solar PV Market, India, Installed Capacity (GW), 2011–2030

Table 13: Solar PV Market, India, Major Active Plants

Table 14: Solar PV Market, India, Major Upcoming Plants

Table 15: Solar PV Market, India, Auctions

Table 16: Solar PV Market, India, Major Manufacturers, 2021

Table 17: Solar PV Market, India, Major Contracts, 2020–2022

Table 18: Solar PV Market, Japan, Major Active Plants

Table 19: Solar PV Market, Japan, Major Upcoming Plants

Table 20: Solar PV Market, Japan, Auctions

Table 21: Solar PV Market, Japan, Major Manufacturers, 2021

Table 22: Solar PV Market, Japan, Major Contracts, 2020–2022

Table 23: Solar PV Market, South Korea, Major Active Plants

Table 24: Solar PV Market, South Korea, Major Upcoming Plants

Table 25: Solar PV Market, South Korea, Major Manufacturers, 2021

Table 26: Solar PV Market, South Korea, Major Contracts, 2020–2022

Table 27: Solar PV Market, Australia, Major Active Plants

Table 28: Solar PV Market, Australia, Major Upcoming Plants

Table 29: Solar PV Market, Australia, Major Manufacturers, 2021

Table 30: Solar PV Market, Australia, Major Contracts, 2020–2022

Table 31: Solar PV Market, France, Major Active Plants

Table 32: Solar PV Market, France, Major Upcoming Plants

Table 33: Solar PV Market, France, Auctions

Table 34: Solar PV Market, France, Major Manufacturers, 2021

Table 35: Solar PV Market, France, Major Contracts, 2020–2022

Table 36: Solar PV Market, Germany, Major Active Plants

Table 37: Solar PV Market, Germany, Major Upcoming Plants

Table 38: Solar PV Market, Germany, Auctions

Table 39: Solar PV Market, Germany, Major Manufacturers, 2021

Table 40: Solar PV Market, Germany, Major Contracts, 2020–2022

Table 41: Solar PV Market, Italy, Major Active Plants

Table 42: Solar PV Market, Italy, Major Upcoming Plants

Table 43: Solar PV Market, Italy, Auctions

Table 44: Solar PV Market, Italy, Major Manufacturers, 2021

Table 45: Solar PV Market, Italy, Major Contracts, 2020-2022

Table 46: Solar PV Market, Spain, Installed Capacity (GW), 2011–2030

Table 47: Solar PV Market, Spain, Major Active Plants

Table 48: Solar PV Market, Spain, Major Upcoming Plants

Table 49: Solar PV Market, Spain, Auctions

Table 50: Solar PV Market, Spain, Major Manufacturers, 2021

Table 51: Solar PV Market, Spain, Major Contracts, 2020–2022

Table 52: Solar PV Market, Vietnam, Installed Capacity (GW), 2011–2030

Table 53: Solar PV Market, Vietnam, Major Active Plants

Table 54: Solar PV Market, Vietnam, Major Upcoming Plants

Table 55: Solar PV Market, Vietnam, Import and Export ($bn), 2018–2021

Table 56: Solar PV Market, Vietnam, Major Manufacturers, 2021

Table 57: Solar PV Market, Vietnam, Major Contracts, 2020–2022

Table 58: Abbreviations

Figures

List of Figures

Figure 1: Solar PV Market, Global, Installed Capacity (GW), 2011–2030

Figure 2: Solar PV Market, Installed Capacity by Region (GW), 2021

Figure 3: Solar PV Market, Cumulative Capacity by Country (GW), 2021

Figure 4: Solar PV Market, Solar PV Overview

Figure 5: Solar PV Market, Solar PV Value Chain

Figure 6: Solar PV Market, Global, Snapshot, 2021

Figure 7: Solar PV Market, Global, Installed Capacity (GW), 2011–2030

Figure 8: Solar PV Market, Global, Installed Capacity by Region (GW), 2021

Figure 9: Solar PV Market, Global, Installed Capacity by Country (GW), 2021

Figure 10: Solar PV Market, Global, Annual Capacity Additions by Segment

Figure 11: Solar PV Market, Global, Generation (TWh), 2011–2030

Figure 12: Solar PV Market, Global, Generation by Region (TWh), 2021

Figure 13: Solar PV Market, Global, Generation by Country (TWh), 2021

Figure 14: Solar PV Market, Global, Market Size ($bn), 2011–2030

Figure 15: Solar PV Market, Global, Number of Jobs, 2012–2021

Figure 16: Solar PV Market, Global, Crystalline Silicon Modules Market Share (%), 2021

Figure 17: Solar PV Market, Global, Thin-Film Modules Market Share (%), 2021

Figure 18: Solar PV Market, the US, Snapshot, 2021

Figure 19: Solar PV Market, the US, Installed Capacity (GW), 2011–2030

Figure 20: Solar PV Market, the US, Cumulative Capacity by State (GW), 2021

Figure 21: Solar PV Market, the US, Annual Capacity Additions by State (MW), 2021

Figure 22: Solar PV Market, the US, Annual Capacity Additions by Segment

Figure 23: Solar PV Market, the US, Electricity Generation (TWh), 2011–2030

Figure 24: Solar PV Market, the US, Electricity Generation by State (TWh), 2021

Figure 25: Solar PV Market, the US, Reduction in GHG Emissions (million tonnes), 2011–2030

Figure 26: Solar PV Market, the US, Deal Value and Number of Deals, 2010–2021

Figure 27: Solar PV Market, the US, Deals by Type (%), 2021

Figure 28: Solar PV Market, the US, Number of Jobs (Thousands), 2010–2021

Figure 29: Solar PV Market, the US, Market Size ($bn), 2011–2030

Figure 30: Solar PV Market, the US, Import and Export ($bn), 2010–2021

Figure 31: Solar PV Market, China, Snapshot, 2021

Figure 32: Solar PV Market, China, Installed Capacity (GW), 2011–2030

Figure 33: Solar PV Market, China, Annual Capacity Additions by Segment

Figure 34: Solar PV Market, China, Electricity Generation (TWh), 2011–2030

Figure 35: Solar PV Market, China, Reduction in GHG Emissions (million tonnes), 2011–2030

Figure 36: Solar PV Market, China, Deal Value and Number of Deals, 2010–2021

Figure 37: Solar PV Market, China, Deals by Type (%), 2021

Figure 38: Solar PV Market, China, Number of Jobs (Thousands), 2012–2021

Figure 39: Solar PV Market, China, Market Size ($bn), 2011–2030

Figure 40: Solar PV Market, China, Import and Export ($bn), 2010–2021

Figure 41: Solar PV Market, India, Snapshot, 2021

Figure 42: Solar PV Market, India, Installed Capacity (GW), 2011–2030

Figure 43: Solar PV Market, India, Annual Capacity Additions by Segment

Figure 44: Solar PV Market, India, Electricity Generation (TWh), 2011–2030

Figure 45: Solar PV Market, India, Reduction in GHG Emissions (million tonnes), 2011–2030

Figure 46: Solar PV Market, India, Deal Value and Number of Deals, 2010–2021

Figure 47: Solar PV Market, India, Deals by Type (%), 2021

Figure 48: Solar PV Market, India, Number of Jobs (Thousands), 2012–2021

Figure 49: Solar PV Market, India, Market Size ($bn), 2011–2030

Figure 50: Solar PV Market, India, Import and Export ($m), 2010–2021

Figure 51: Solar PV Market, Japan, Snapshot, 2020

Figure 52: Solar PV Market, Japan, Installed Capacity (GW), 2011–2030

Figure 53: Solar PV Market, Japan, Annual Capacity Additions by Segment

Figure 54: Solar PV Market, Japan, Electricity Generation (TWh), 2011–2030

Figure 55: Solar PV Market, Japan, Reduction in GHG Emissions (million tonnes), 2011–2030

Figure 56: Solar PV Market, Japan, Deal Value and Number of Deals, 2010–2021

Figure 57: Solar PV Market, Japan, Deals by Type (%), 2021

Figure 58: Solar PV Market, Japan, Number of Jobs (Thousands), 2014–2021

Figure 59: Solar PV Market, Japan, Market Size ($bn), 2011–2030

Figure 60: Solar PV Market, Japan, Import and Export ($bn), 2010–2021

Figure 61: Solar PV Market, South Korea, Snapshot, 2021

Figure 62: Solar PV Market, South Korea, Installed Capacity (GW), 2011–2030

Figure 63: Solar PV Market, South Korea, Annual Capacity Additions by Segment

Figure 64: Solar PV Market, South Korea, Electricity Generation (TWh), 2011–2030

Figure 65: Solar PV Market, South Korea, Reduction in GHG Emissions (million tonnes), 2011–2030

Figure 66: Solar PV Market, South Korea, Deal Value and Number of Deals, 2010–2021

Figure 67: Solar PV Market, South Korea, Deals by Type (%), 2021

Figure 68: Solar PV Market, South Korea, Number of Jobs, 2015–2021

Figure 69: Solar PV Market, South Korea, Market Size ($bn), 2011–2030

Figure 70: Solar PV Market, South Korea, Import and Export ($bn), 2010–2020

Figure 71: Solar PV Market, Australia, Snapshot, 2021

Figure 72: Solar PV Market, Australia, Installed Capacity (GW), 2011–2030

Figure 73: Solar PV Market, Australia, Annual Capacity Additions by Segment

Figure 74: Solar PV Market, Australia, Electricity Generation (TWh), 2011–2030

Figure 75: Solar PV Market, Australia, Reduction in GHG Emissions (million tonnes), 2011–2030

Figure 76: Solar PV Market, Australia, Deal Value and Number of Deals, 2010–2021

Figure 77: Solar PV Market, Australia, Deals by Type (%), 2021

Figure 78: Solar PV Market, Australia, Number of Jobs, 2018–2021

Figure 79: Solar PV Market, Australia, Market Size ($bn), 2011–2030

Figure 80: Solar PV Market, Australia, Import and Export ($m), 2010–2021

Figure 81: Solar PV Market, France, Snapshot, 2021

Figure 82: Solar PV Market, France, Installed Capacity (GW), 2011–2030

Figure 83: Solar PV Market, France, Annual Capacity Additions by Segment

Figure 84: Solar PV Market, France, Electricity Generation (TWh), 2011–2030

Figure 85: Solar PV Market, France, Reduction in GHG Emissions (million tonnes), 2011–2030

Figure 86: Solar PV Market, France, Deal Value and Number of Deals, 2010–2021

Figure 87: Solar PV Market, France, Deals by Type (%), 2021

Figure 88: Solar PV Market, France, Number of Jobs, 2014–2021

Figure 89: Solar PV Market, France, Market Size ($bn), 2011–2030

Figure 90: Solar PV Market, France, Import and Export ($m), 2010–2021

Figure 91: Solar PV Market, Germany, Snapshot, 2021

Figure 92: Solar PV Market, Germany, Installed Capacity (GW), 2011–2030

Figure 93: Solar PV Market, Germany, Annual Capacity Additions by Segment

Figure 94: Solar PV Market, Germany, Electricity Generation (TWh), 2011–2030

Figure 95: Solar PV Market, Germany, GHG Emission Reductions (million tonnes), 2011–2030

Figure 96: Solar PV Market, Germany, Deal Value and Number of Deals, 2010–2021

Figure 97: Solar PV Market, Germany, Deals by Type (%), 2021

Figure 98: Solar PV Market, Germany, Number of Jobs (Thousands), 2011–2021

Figure 99: Solar PV Market, Germany, Market Size ($bn), 2011–2030

Figure 100: Solar PV Market, Germany, Import and Export ($bn), 2010–2021

Figure 101: Solar PV Market, the Italy, Snapshot, 2021

Figure 102: Solar PV Market, Italy, Installed Capacity (GW), 2011–2030

Figure 103: Solar PV Market, Italy, Annual Capacity Additions by Segment

Figure 104: Solar PV Market, Italy, Electricity Generation (TWh), 2011–2030

Figure 105: Solar PV Market, Italy, Reduction in GHG Emissions (million tonnes), 2011–2030

Figure 106: Solar PV Market, Italy, Deal Value and Number of Deals, 2010–2021

Figure 107: Solar PV Market, Italy, Deals by Type (%), 2021

Figure 108: Solar PV Market, Italy, Number of Jobs, 2014–2021

Figure 109: Solar PV Market, Italy, Market Size ($bn), 2011–2030

Figure 110: Solar PV Market, Italy, Import and Export ($m), 2010–2021

Figure 111: Solar PV Market, Spain, Snapshot, 2021

Figure 112: Solar PV Market, Spain, Installed Capacity (GW), 2011–2030

Figure 113: Solar PV Market, Spain, Annual Capacity Additions by Segment

Figure 114: Solar PV Market, Spain, Electricity Generation (TWh), 2011–2030

Figure 115: Solar PV Market, Spain, Reduction in GHG Emissions (million tonnes), 2011–2030

Figure 116: Solar PV Market, Spain, Deal Value and Number of Deals, 2010–2021

Figure 117: Solar PV Market, Spain, Deals by Type (%), 2021

Figure 118: Solar PV Market, Spain, Number of Jobs, 2016–2021

Figure 119: Solar PV Market, Spain, Market Size ($m), 2011–2030

Figure 120: Solar PV Market, Spain, Import and Export ($m), 2010–2021

Figure 121: Solar PV Market, Vietnam, Snapshot, 2021

Figure 122: Solar PV Market, Vietnam, Installed Capacity (GW), 2011–2030

Figure 123: Solar PV Market, Vietnam, Annual Capacity Additions by Segment

Figure 124: Solar PV Market, Vietnam, Electricity Generation (TWh), 2011–2030

Figure 125: Solar PV Market, Vietnam, Reduction in GHG Emissions (million tonnes), 2011–2030

Figure 126: Solar PV Market, Vietnam, Deal Value and Number of Deals, 2010–2021

Figure 127: Solar PV Market, Vietnam, Deals by Type (%), 2021

Figure 128: Solar PV Market, Vietnam, Number of Jobs, 2018–2021

Figure 129: Solar PV Market, Vietnam, Market Size ($m), 2011–2030

Figure 130: Solar PV Market, Vietnam, Import and Export ($bn), 2018–2021

Frequently asked questions

Solar Photovoltaic (PV) Market Size, Share and Trends Analysis by Technology, Installed Capacity, Generation, Drivers, Constraints, Key Players and Forecast, 2022-2030 standard reports
Currency USD
$3,995

Can be used by individual purchaser only

$11,985

Can be shared globally by unlimited users within the purchasing corporation e.g. all employees of a single company


Undecided about purchasing this report?

Enquire Before Buying Request a Free Sample

Get in touch to find out about multi-purchase discounts

reportstore@globaldata.com
Tel +44 20 7947 2745

Every customer’s requirement is unique. With over 220,000 construction projects tracked, we can create a tailored dataset for you based on the types of projects you are looking for. Please get in touch with your specific requirements and we can send you a quote.

Sample Report

Solar Photovoltaic (PV) Market Size, Share and Trends Analysis by Technology, Installed Capacity, Generation, Drivers, Constraints, Key Players and Forecast, 2022-2030 was curated by the best experts in the industry and we are confident about its unique quality. However, we want you to make the most beneficial decision for your business, so we offer free sample pages to help you:

  • Assess the relevance of the report
  • Evaluate the quality of the report
  • Justify the cost

Download your copy of the sample report and make an informed decision about whether the full report will provide you with the insights and information you need.

Below is a sample report to understand what you are buying

See what our customers are saying

“The GlobalData platform is our go-to tool for intelligence services. GlobalData provides an easy way to access comprehensive intelligence data around multiple sectors, which essentially makes it a one-for-all intelligence platform, for tendering and approaching customers.

GlobalData is very customer orientated, with a high degree of personalised services, which benefits everyday use. The highly detailed project intelligence and forecast reports can be utilised across multiple departments and workflow scopes, from operational to strategic level, and often support strategic decisions. GlobalData Analytics and visualisation solutions has contributed positively when preparing management presentations and strategic papers.”

Business Intelligence & Marketing Manager, SAL Heavy Lift

“COVID-19 has caused significant interference to our business and the COVID-19 intelligence from GlobalData has helped us reach better decisions around strategy. These two highlights have helped enormously to understand the projections into the future concerning our business units, we also utilise the project database to source new projects for Liebherr-Werk to use as an additional source to pitch for new business.”

Market Analyst & Management, Liebherr-Werk

Your daily news has saved me a lot of time and keeps me up-to-date with what is happening in the market, I like that you almost always have a link to the source origin. We also use your market data in our Strategic Business Process to support our business decisions. By having everything in one place on the Intelligence Center it has saved me a lot of time versus looking on different sources, the alert function also helps with this.

Head of Key Accounts, Saab AB

Having used several other market research companies, I find that GlobalData manages to provide that ‘difficult-to-get’ market data that others can’t, as well as very diverse and complete consumer surveys.

Marketing Intelligence Manager, Portugal Foods

Our experience with GlobalData has been very good, from the platform itself to the people. I find that the analysts and the account team have a high level of customer focus and responsiveness and therefore I can always rely on. The platform is more holistic than other providers. It is convenient and almost like a one stop shop. The pricing suite is highly competitive and value for our organisation.

I like reports that inform new segments such as the analysis on generation Z, millennials, the impact of COVID 19 to our banking customers and their new channel habits. Secondly the specialist insight on affluent sector significantly increases our understanding about this group of customers. The combination of those give us depth and breadth of the evolving market.

I’m in the business of answering and helping people make decisions so with the intelligence center I can do that, effectively and efficiently. I can share quickly key insights that answer and satisfy our country stakeholders by giving them many quality studies and primary research about competitive landscape beyond the outlook of our bank. It helps me be seen as an advisory partner and that makes a big difference. A big benefit of our subscription is that no one holds the whole data and because it allows so many people, so many different parts of our organisation have access, it enables all teams to have the same level of knowledge and decision support.

Head of Customer Insight and Research, Standard Chartered

“I know that I can always rely on Globaldata’s work when I’m searching for the right consumer and market insights. I use Globaldata insights to understand the changing market & consumer landscape and help create better taste & wellbeing solutions for our customers in food, beverage and healthcare industries.

Globaldata has the right data and the reports are of very high quality compared to your competitors. Globaldata not only has overall market sizes & consumer insights on food & beverages but also provides insights at the ingredient & flavour level. That is key for B2B companies like Givaudan. This way we understand our customers’ business and also gain insight to our unique industry”

Head of Consumer Sensory Insights, Givaudan

GlobalData provides a great range of information and reports on various sectors that is highly relevant, timely, easy to access and utilise.  The reports and data dashboards help engagement with clients; they provide valuable industry and market insights that can enrich client conversations and can help in the shaping of value propositions. Moreover, using GlobalData products has helped increase my knowledge of the finance sector, the players within it, and the general threats and opportunities.

I find the consumer surveys that are carried out to be extremely beneficial and not something I have seen anywhere else. They provided an insightful view of why and which consumers take (or don’t) particular financial products. This can help shape conversations with clients to ensure they make the right strategic decisions for their business.

One of the challenges I have found is that data in the payments space is often piecemeal. With GD all of the data I need is in one place, but it also comes with additional market reports that provide useful extra context and information. Having the ability to set-up alerts on relevant movements in the industry, be it competitors or customers, and have them emailed directly to me, ensures I get early sight of industry activity and don’t have to search for news.

Senior Account Manager, TSYS
Go even deeper with GlobalData Intelligence Center

Every Company Report we produce is powered by the GlobalData Intelligence Center.

Subscribing to our intelligence platform means you can monitor developments at Solar Photovoltaic (PV) Market Size, Share and Trends Analysis by Technology, Installed Capacity, Generation, Drivers, Constraints, Key Players and Forecast, 2022-2030 in real time.

  • Access a live Solar Photovoltaic (PV) Market Size, Share and Trends Analysis by Technology, Installed Capacity, Generation, Drivers, Constraints, Key Players and Forecast, 2022-2030 dashboard for 12 months, with up-to-the-minute insights.
  • Fuel your decision making with real-time deal coverage and media activity.
  • Turn insights on financials, deals, products and pipelines into powerful agents of commercial advantage.