Europe, North America and Former Soviet Union (FSU) Underground Gas Storage Industry Installed Capacity and Capital Expenditure (CapEx) Forecast by Region and Countries including details of All Active Plants, Planned and Announced Projects, 2022-2026
Powered by ![]()
All the vital news, analysis, and commentary curated by our industry experts.

The working gas capacity in North America, Europe, and the Former Soviet Union (FSU) in 2022 are 5,805 bcf, 4,257 bcf, and 3,479 bcf respectively. The countries with the highest working gas capacity in North America, Europe, and FSU are the US, Germany, and Russia respectively. The largest active underground gas storage site in North America, Europe, and FSU are Baker, Emden, and Bilche-Volytsa respectively.
The Europe, North America, and Former Soviet Union (FSU) underground gas storage market research report provides gas storage site details such as asset name, operator name, storage type, start year, working gas capacity along with withdrawal rate for all active, planned and announced gas storage assets in the regions. The report provides key country comparisons based on contribution to working gas capacity. It also provides regional capital expenditure outlook by key countries, year on year, till 2026. Furthermore, it offers recent developments and contracts in these three regions, wherever available.
Planned and Announced Gas Storage Sites
North America: Some of the major planned and announced gas storage sites in North America are Burgos, Magnum, Hackberry, Clear Creek I, and Spire Storage II.
Europe: Some of the major planned and announced gas storage sites in Europe are Deborah, Golianovo, Galata, Dumre I, and Moeckow.
Former Soviet Union: Some of the major planned and announced gas storage sites in FSU are Stepnovskoe II, Bednodemyanovskoye I, Kanchurinsko-Musinsky Complex II, Gazli III, and Gazli II.
Underground Gas Storage Industry Annual Capital Expenditure Outlook
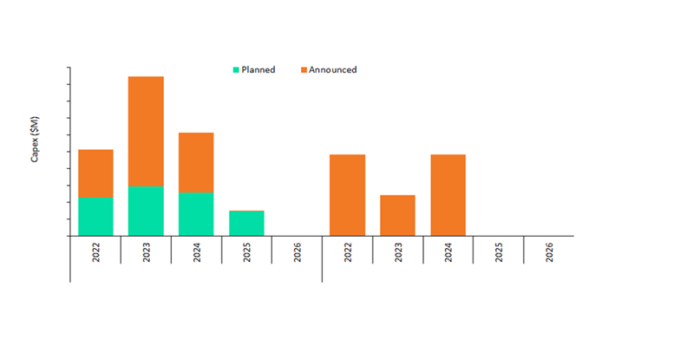
North America: The key countries analyzed for capital expenditure of the underground gas storage industry in North America are the US, Canada, and Mexico. The US has the highest capital expenditure for planned gas storage sites in 2022.
North America Underground Gas Storage Industry Annual Capital Expenditure Analysis
For More Capital Expenditure Insights into the North America Underground Gas Storage Industry, download a free report sample
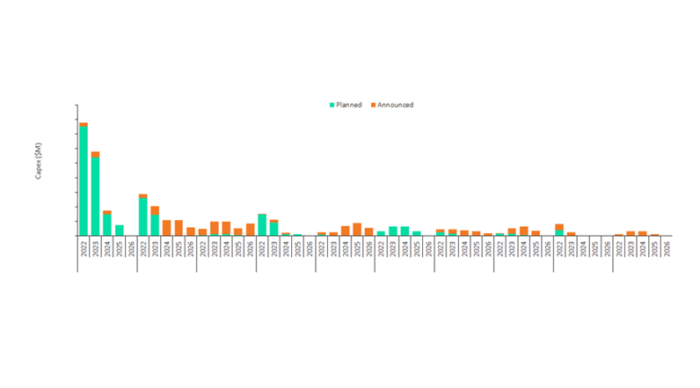
Europe: The key countries analyzed for capital expenditure of the underground gas storage industry in Europe are the UK, Germany, Italy, Netherlands, France, Austria, Hungary, Czech Republic, Poland, Slovakia, Romania, Spain, and Serbia among others. As of 2022, the UK has the highest capital expenditure for planned gas storage sites.
Europe: The key countries analyzed for capital expenditure of the underground gas storage industry in Europe are the UK, Germany, Italy, Netherlands, France, Austria, Hungary, Czech Republic, Poland, Slovakia, Romania, Spain, and Serbia among others. As of 2022, the UK has the highest capital expenditure for planned gas storage sites.
Europe Underground Gas Storage Industry Annual Capital Expenditure Analysis
For More Capital Expenditure Insights into the Europe Underground Gas Storage Industry, download a free report sample
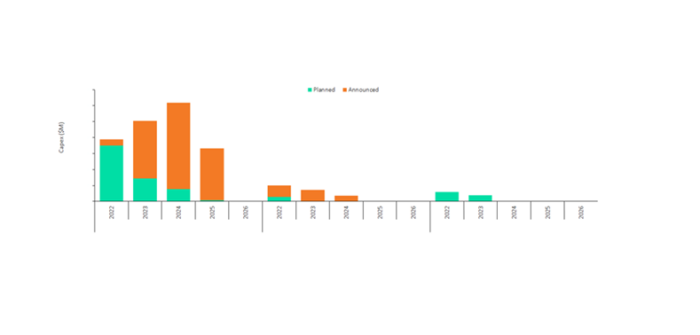
Former Soviet Union: The key countries analyzed for capital expenditure of the underground gas storage industry in FSU are Russia, Ukraine, Kazakhstan, Uzbekistan, Azerbaijan, Latvia, Georgia, Belarus, and Armenia. Russia has the highest capital expenditure for planned gas storage sites in 2022.
Former Soviet Union Underground Gas Storage Industry Annual Capital Expenditure Analysis
For More Capital Expenditure Insights into the FSU Underground Gas Storage Industry, download a free report sample
Europe, North America, and FSU Underground Gas Storage Market Report Overview
| Working Gas Capacity (North America – 2022) | 5,805 bcf |
| Working Gas Capacity (Europe – 2022) | 4,257 bcf |
| Working Gas Capacity (FSU – 2022) | 3,479 bcf |
| Major Planned and Announced Gas Storage Sites (North America) | Burgos, Magnum, Hackberry, Clear Creek I, and Spire Storage II |
| Major Planned and Announced Gas Storage Sites (Europe) | Deborah, Golianovo, Galata, Dumre I, and Moeckow |
| Major Planned and Announced Gas Storage Sites (FSU) | Stepnovskoe II, Bednodemyanovskoye I, Kanchurinsko-Musinsky Complex II, Gazli III, and Gazli II |
| Key Countries (North America) | The US, Canada, and Mexico |
| Key Countries (Europe) | The UK, Germany, Italy, Netherlands, France, Austria, Hungary, Czech Republic, Poland, Slovakia, Romania, Spain, and Serbia Among Others |
| Key Countries (FSU) | Russia, Ukraine, Kazakhstan, Uzbekistan, Azerbaijan, Latvia, Georgia, Belarus, and Armenia |
Scope
- Updated information on active, planned and announced underground gas storage sites in North America, Europe, and the Former Soviet Union
- Provides key details such as site name, operator name, type, start year, total storage capacity, working gas capacity, and maximum withdrawal rate for all active planned and announced underground gas storage sites in North America, Europe, and the Former Soviet Union
- Provides capital expenditure outlook by year and by key countries for planned and announced underground gas storage sites in North America, Europe, and the Former Soviet Union for the period 2022-2026
- Latest developments and contracts related to the underground gas storage industry in these three regions, wherever available
Reasons to Buy
- Obtain the most up-to-date information available on active, planned, and announced gas storage sites in North America, Europe, and the Former Soviet Union
- Identify growth segments and opportunities in the underground gas storage industry
- Facilitate decision-making based on strong historic and outlook of capacity data
- Assess your competitor’s key gas storage sites portfolio
Table of Contents
Table
Figures
Frequently asked questions
-
What is North America working gas capacity in 2022?
The working gas capacity in North America is valued at 5,805 bcf in 2022.
-
What is the Europe working gas capacity in 2022?
The working gas capacity in Europe is valued at 4,257 bcf in 2022.
-
What is the FSU working gas capacity in 2022?
The working gas capacity in FSU is valued at 3,479 bcf in 2022.
-
What are the major planned and announced gas storage sites in the North America underground gas storage industry?
Some of the major planned and announced gas storage sites in the North America underground gas storage industry are Burgos, Magnum, Hackberry, Clear Creek I, and Spire Storage II.
-
What are the major planned and announced gas storage sites in the Europe underground gas storage industry?
Some of the major planned and announced gas storage sites in the Europe underground gas storage industry are Deborah, Golianovo, Galata, Dumre I, and Moeckow.
-
What are the major planned and announced gas storage sites in the FSU underground gas storage industry?
Some of the major planned and announced gas storage sites in the FSU underground gas storage industry are Stepnovskoe II, Bednodemyanovskoye I, Kanchurinsko-Musinsky Complex II, Gazli III, and Gazli II.
-
Which are the key countries in the North America underground gas storage industry?
The key countries analyzed for capital expenditure of the underground gas storage industry in North America are the US, Canada, and Mexico.
-
Which are the key countries in the Europe underground gas storage industry?
The key countries analyzed for capital expenditure of the underground gas storage industry in Europe are the UK, Germany, Italy, Netherlands, France, Austria, Hungary, Czech Republic, Poland, Slovakia, Romania, Spain, and Serbia among others.
-
Which are the key countries in the FSU underground gas storage industry?
The key countries analyzed for capital expenditure of the underground gas storage industry in FSU are Russia, Ukraine, Kazakhstan, Uzbekistan, Azerbaijan, Latvia, Georgia, Belarus, and Armenia.
Get in touch to find out about multi-purchase discounts
reportstore@globaldata.com
Tel +44 20 7947 2745
Every customer’s requirement is unique. With over 220,000 construction projects tracked, we can create a tailored dataset for you based on the types of projects you are looking for. Please get in touch with your specific requirements and we can send you a quote.
Sample Report
Europe, North America and Former Soviet Union (FSU) Underground Gas Storage Industry Installed Capacity and Capital Expenditure (CapEx) Forecast by Region and Countries including details of All Active Plants, Planned and Announced Projects, 2022-2026 was curated by the best experts in the industry and we are confident about its unique quality. However, we want you to make the most beneficial decision for your business, so we offer free sample pages to help you:
- Assess the relevance of the report
- Evaluate the quality of the report
- Justify the cost
Download your copy of the sample report and make an informed decision about whether the full report will provide you with the insights and information you need.


