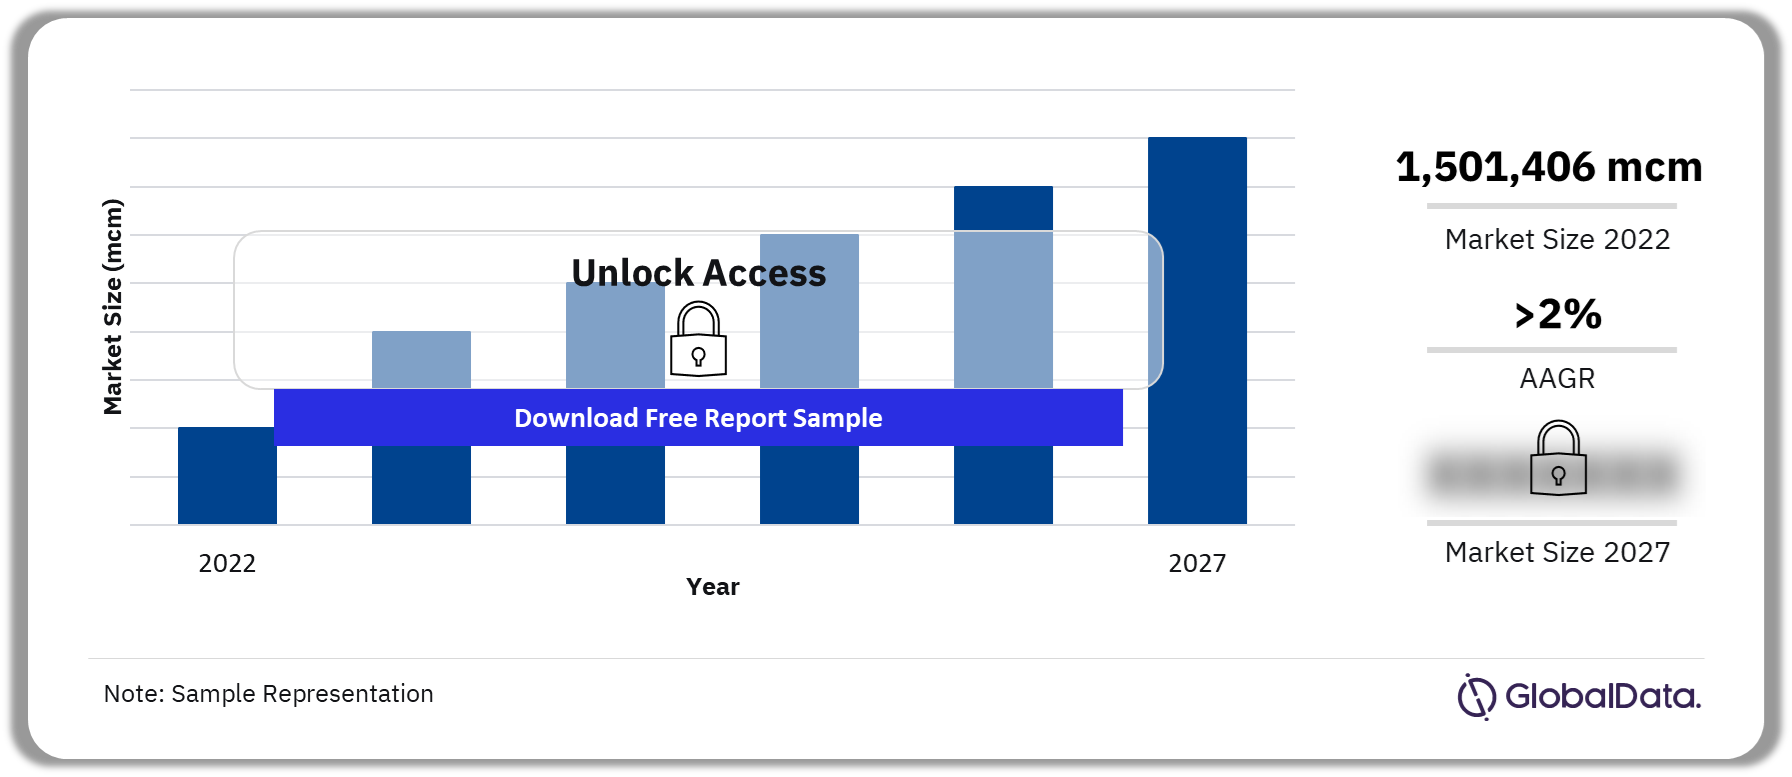
Table 1: Liquids storage industry, global, key statistics, 2022 31
Table 2: Liquids storage industry, global, liquids storage capacity by key countries (mcm), 2017–2027 32
Table 3: Liquids storage industry, global, crude oil storage capacity by key countries (mcm), 2017–2027 33
Table 4: Liquids storage industry, global, petroleum product storage capacity by key countries (mcm), 2017–2027 34
Table 5: Liquids storage industry, global, chemicals storage capacity by key countries (mcm), 2017–2027 35
Table 6: Liquids storage industry, global, top 10 planned and announced liquids storage terminals (mcm),2023–2027 36
Table 7: Global, annual new build and expansion capital expenditure outlook for liquids storage terminals ($M), 2023–2027 37
Table 8: Liquids storage industry, global, annual new build and expansion capital expenditure outlook for liquids storage terminal by key countries ($M), 2023–2027 38
Table 9: Liquids storage industry, global, storage capacity additions through new and existing storage terminals by region (mcm), 2023–2027 39
Table 10: Liquids storage industry, global, capacity additions through new storage terminals by region (mcm), 2023–2027 40
Table 11: Liquids Storage Industry, global, capacity Additions through Expansions of Existing Storage Terminals by Region (mcm), 2023–2027 40
Table 12: Liquids storage industry, global, regional comparison based on contribution to global storage capacity (%), 2017–2027 41
Table 13: Liquids storage industry, Africa, key statistics, 2022 43
Table 14: Liquids storage industry, Africa, liquids storage capacity by key countries (mcm), 2017–2027 44
Table 15: Liquids storage industry, Africa, crude oil storage capacity by key countries (mcm), 2017–2027 45
Table 16: Liquids storage industry, Africa, petroleum products storage capacity by key countries (mcm), 2017–2027 46
Table 17: Liquids storage industry, Africa, chemicals storage capacity by key countries (mcm), 2017–2027 47
Table 18: Liquids storage industry, Africa, planned and announced liquids storage terminals, 2023–2027 48
Table 19: Africa, annual new build and expansion capital expenditure outlook for liquids storage terminals ($M), 2023–2027 51
Table 20: Liquids storage industry, Africa, annual new build and expansion capital expenditure outlook for liquids storage terminal by key countries ($M), 2023–2027 52
Table 21: Liquids storage industry, Africa, capacity additions through new and existing storage terminals by key countries (mcm), 2023–2027 53
Table 22: Liquids storage industry, Africa, capacity additions through new storage terminals by region (mcm), 2023–2027 54
Table 23: Liquids Storage Industry, Africa, capacity Additions through Expansions of Existing Storage Terminals by Region (mcm), 2023–2027 54
Table 24: Liquids storage industry, Africa, country comparison based on contribution to regional storage capacity (%), 2017–2027 55
Table 25: Liquids storage industry, South Africa, storage capacity (mcm), 2017–2027 57
Table 26: Liquids storage industry, Namibia, storage capacity (mcm), 2017–2027 62
Table 27: Liquids storage industry, Nigeria, storage capacity (mcm), 2017–2027 63
Table 28: Liquids storage industry, Egypt, storage capacity (mcm), 2017–2027 68
Table 29: Liquids storage industry, Libya, storage capacity (mcm), 2017–2027 69
Table 30: Liquids storage industry, Algeria, storage capacity (mcm), 2017–2027 70
Table 31: Liquids storage industry, Morocco, storage capacity (mcm), 2017–2027 71
Table 32: Liquids storage industry, Ghana, storage capacity (mcm), 2017–2027 72
Table 33: Liquids storage industry, Cote d’Ivoire, storage capacity (mcm), 2017–2027 74
Table 34: Liquids storage industry, Kenya, storage capacity (mcm), 2017–2027 75
Table 35: Liquids storage industry, Tunisia, storage capacity (mcm), 2017–2027 77
Table 36: Liquids storage industry, Angola, storage capacity (mcm), 2017–2027 78
Table 37: Liquids storage industry, Cameroon, storage capacity (mcm), 2017–2027 80
Table 38: Liquids storage industry, Tanzania, storage capacity (mcm), 2017–2027 82
Table 39: Liquids storage industry, Gabon, storage capacity (mcm), 2017–2027 84
Table 40: Liquids storage industry, Senegal, storage capacity (mcm), 2017–2027 85
Table 41: Liquids storage industry, Mozambique, storage capacity (mcm), 2017–2027 86
Table 42: Liquids storage industry, Zimbabwe, storage capacity (mcm), 2017–2027 87
Table 43: Liquids storage industry, Congo Republic, storage capacity (mcm), 2017–2027 88
Table 44: Liquids storage industry, Sudan, storage capacity (mcm), 2017–2027 88
Table 45: Liquids storage industry, Djibouti, storage capacity (mcm), 2017–2027 89
Table 46: Liquids storage industry, Madagascar, storage capacity (mcm), 2017–2027 89
Table 47: Liquids storage industry, Zambia, storage capacity (mcm), 2017–2027 90
Table 48: Liquids storage industry, Ethiopia, storage capacity (mcm), 2017–2027 91
Table 49: Liquids storage industry, Sierra Leone, storage capacity (mcm), 2017–2027 92
Table 50: Liquids storage industry, Mauritius, storage capacity (mcm), 2017–2027 92
Table 51: Liquids storage industry, Benin, storage capacity (mcm), 2017–2027 93
Table 52: Liquids storage industry, Cape Verde, storage capacity (mcm), 2017–2027 93
Table 53: Liquids storage industry, Liberia, storage capacity (mcm), 2017–2027 94
Table 54: Liquids storage industry, Botswana, storage capacity (mcm), 2017–2027 95
Table 55: Liquids storage industry, Malawi, storage capacity (mcm), 2017–2027 96
Table 56: Liquids storage industry, Gambia, storage capacity (mcm), 2017–2027 96
Table 57: Liquids storage industry, Uganda, storage capacity (mcm), 2017–2027 97
Table 58: Liquids storage industry, Somalia, storage capacity (mcm), 2017–2027 98
Table 59: Liquids storage industry, Democratic Republic of the Congo, storage capacity (mcm), 2017–2027 98
Table 60: Liquids storage industry, Guinea, storage capacity (mcm), 2017–2027 99
Table 61: Liquids storage industry, Equatorial Guinea, storage capacity (mcm), 2017–2027 99
Table 62: Liquids storage industry, Mali, storage capacity (mcm), 2017–2027 100
Table 63: Liquids storage industry, South Sudan, storage capacity (mcm), 2017–2027 100
Table 64: Liquids storage industry, Burundi, storage capacity (mcm), 2017–2027 101
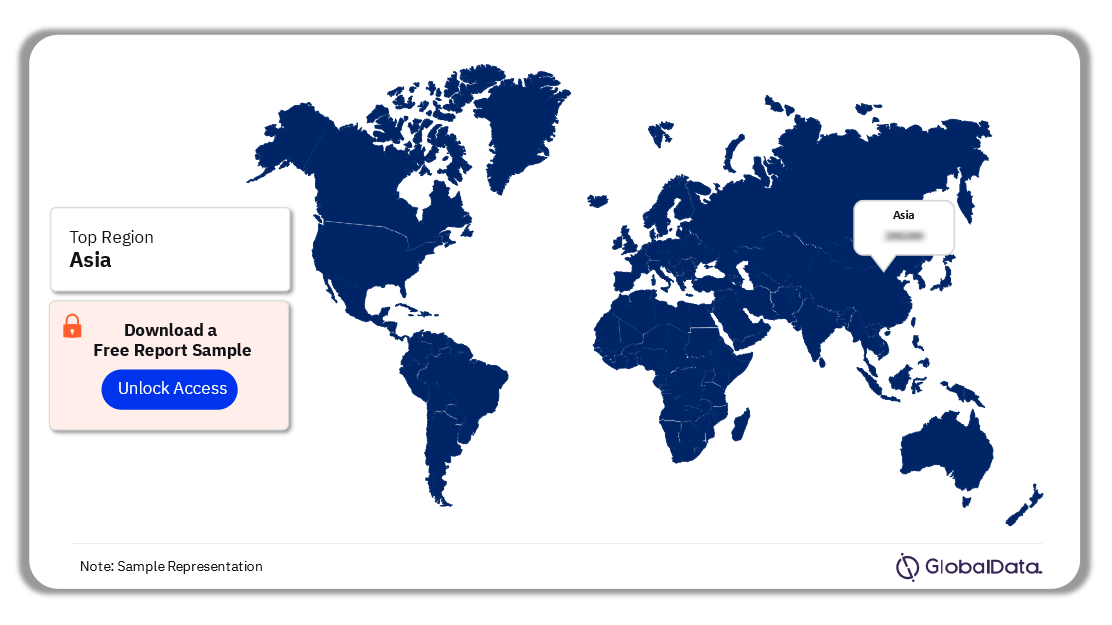
Table 65: Liquids storage industry, Asia, key statistics, 2022 104
Table 66: Liquids storage industry, Asia, liquids storage capacity by key countries (mcm), 2017–2027 105
Table 67: Liquids storage industry, Asia, crude oil storage capacity by key countries (mcm), 2017–2027 106
Table 68: Liquids storage industry, Asia, petroleum products storage capacity by key countries (mcm), 2017–2027 107
Table 69: Liquids storage industry, Asia, chemicals storage capacity by key countries (mcm), 2017–2027 108
Table 70: Liquids storage industry, Asia, planned and announced liquids storage terminals, 2023–2027 109
Table 71: Asia, annual new build and expansion capital expenditure outlook for liquids storage terminals ($M), 2023–2027 114
Table 72: Liquids storage industry, Asia, annual new build and expansion capital expenditure outlook for liquids storage terminal by key countries ($M), 2023–2027 115
Table 73: Liquids storage industry, Asia, capacity additions through new and existing storage terminals by key countries (mcm), 2023–2027 116
Table 74: Liquids storage industry, Asia, capacity additions through new storage terminals by region (mcm), 2023–2027 116
Table 75: Liquids Storage Industry, Asia, capacity Additions through Expansions of Existing Storage Terminals by Region (mcm), 2023–2027 117
Table 76: Liquids storage industry, Asia, country comparison based on contribution to regional storage capacity (%), 2017–2027 118
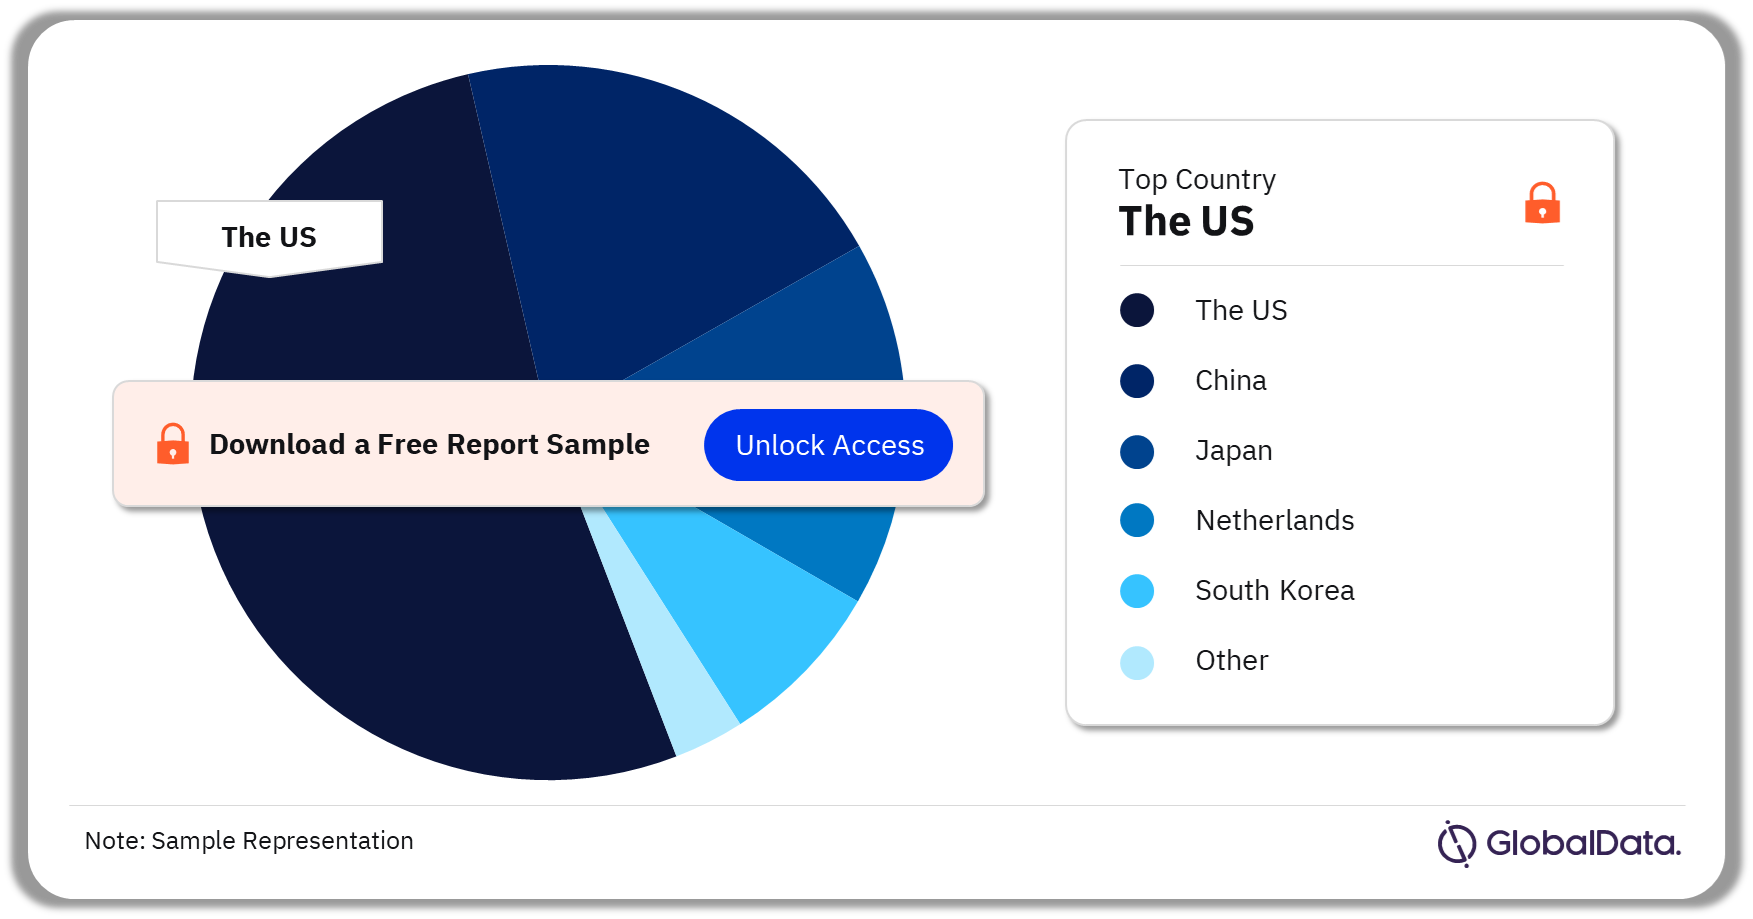
Table 77: Liquids storage industry, China, storage capacity (mcm), 2017–2027 120
Table 78: Liquids storage industry, Japan, storage capacity (mcm), 2017–2027 133
Table 79: Liquids storage industry, South Korea, storage capacity (mcm), 2017–2027 141
Table 80: Liquids storage industry, India, storage capacity (mcm), 2017–2027 144
Table 81: Liquids storage industry, Indonesia, storage capacity (mcm), 2017–2027 155
Table 82: Liquids storage industry, Singapore, storage capacity (mcm), 2017–2027 167
Table 83: Liquids storage industry, Malaysia, storage capacity (mcm), 2017–2027 169
Table 84: Liquids storage industry, Vietnam, storage capacity (mcm), 2017–2027 172
Table 85: Liquids storage industry, Thailand, storage capacity (mcm), 2017–2027 174
Table 86: Liquids storage industry, Pakistan, storage capacity (mcm), 2017–2027 176
Table 87: Liquids storage industry, Myanmar, storage capacity (mcm), 2017–2027 180
Table 88: Liquids storage industry, Philippines, storage capacity (mcm), 2017–2027 181
Table 89: Liquids storage industry, Brunei, storage capacity (mcm), 2017–2027 184
Table 90: Liquids storage industry, Bangladesh, storage capacity (mcm), 2017–2027 185
Table 91: Liquids storage industry, Sri Lanka, storage capacity (mcm), 2017–2027 187
Table 92: Liquids storage industry, Afghanistan, storage capacity (mcm), 2017–2027 188
Table 93: Liquids storage industry, Taiwan, storage capacity (mcm), 2017–2027 190
Table 94: Liquids storage industry, Timor-Leste, storage capacity (mcm), 2017–2027 190
Table 95: Liquids storage industry, Nepal, storage capacity (mcm), 2017–2027 191
Table 96: Liquids storage industry, Mongolia, storage capacity (mcm), 2017–2027 193
Table 97: Liquids storage industry, Maldives, storage capacity (mcm), 2017–2027 193
Table 98: Liquids storage industry, Cambodia, storage capacity (mcm), 2017–2027 194
Table 99: Liquids storage industry, Laos, storage capacity (mcm), 2017–2027 195
Table 100: Liquids storage industry, Caribbean, key statistics, 2022 200
Table 101: Liquids storage industry, Caribbean, liquids storage capacity by key countries (mcm), 2017–2027 201
Table 102: Liquids storage industry, Caribbean, crude oil storage capacity by key countries (mcm), 2017–2027 202
Table 103: Liquids storage industry, Caribbean, petroleum products storage capacity by key countries (mcm), 2017–2027 203
Table 104: Liquids storage industry, Caribbean, chemicals storage capacity by key countries (mcm), 2017–2027 204
Table 105: Caribbean, annual new build and expansion capital expenditure outlook for liquids storage terminals ($M), 2023–2027 205
Table 106: Liquids storage industry, Caribbean, annual new build and expansion capital expenditure outlook for liquids storage terminal by key countries ($M), 2023–2027 206
Table 107: Liquids storage industry, Caribbean, country comparison based on contribution to regional storage capacity (%), 2017–2027 207
Table 108: Liquids storage industry, U.S. Virgin Islands, storage capacity (mcm), 2017–2027 209
Table 109: Liquids storage industry, Curacao, storage capacity (mcm), 2017–2027 210
Table 110: Liquids storage industry, Bahamas, storage capacity (mcm), 2017–2027 210
Table 111: Liquids storage industry, Cuba, storage capacity (mcm), 2017–2027 211
Table 112: Liquids storage industry, Sint Eustatius, storage capacity (mcm), 2017–2027 211
Table 113: Liquids storage industry, Aruba, storage capacity (mcm), 2017–2027 212
Table 114: Liquids storage industry, Puerto Rico, storage capacity (mcm), 2017–2027 213
Table 115: Liquids storage industry, Saint Lucia, storage capacity (mcm), 2017–2027 214
Table 116: Liquids storage industry, Bonaire, storage capacity (mcm), 2017–2027 214
Table 117: Liquids storage industry, Trinidad and Tobago, storage capacity (mcm), 2017–2027 215
Table 118: Liquids storage industry, Dominican Republic, storage capacity (mcm), 2017–2027 216
Table 119: Liquids storage industry, Haiti, storage capacity (mcm), 2017–2027 216
Table 120: Liquids storage industry, Barbados, storage capacity (mcm), 2017–2027 217
Table 121: Liquids storage industry, Antigua and Barbuda, storage capacity (mcm), 2017–2027 217
Table 122: Liquids storage industry, St. Kitts and Nevis, storage capacity (mcm), 2017–2027 218
Table 123: Liquids storage industry, Dominica, storage capacity (mcm), 2017–2027 218
Table 124: Liquids storage industry, Central America, key statistics, 2022 219
Table 125: Liquids storage industry, Central America, liquids storage capacity by key countries (mcm), 2017–2027 220
Table 126: Liquids storage industry, Central America, crude oil storage capacity by key countries (mcm), 2017–2027 221
Table 127: Liquids storage industry, Central America, petroleum products storage capacity by key countries (mcm), 2017–2027 222
Table 128: Liquids storage industry, Central America, chemicals storage capacity by country (mcm), 2017–2027 223
Table 129: Liquids storage industry, Central America, country comparison based on contribution to regional storage capacity (%), 2017–2027 224
Table 130: Liquids storage industry, Panama, storage capacity (mcm), 2017–2027 226
Table 131: Liquids storage industry, Nicaragua, storage capacity (mcm), 2017–2027 227
Table 132: Liquids storage industry, Guatemala, storage capacity (mcm), 2017–2027 228
Table 133: Liquids storage industry, El Salvador, storage capacity (mcm), 2017–2027 230
Table 134: Liquids storage industry, Costa Rica, storage capacity (mcm), 2017–2027 230
Table 135: Liquids storage industry, Honduras, storage capacity (mcm), 2017–2027 231
Table 136: Liquids storage industry, Belize, storage capacity (mcm), 2017–2027 231
Table 137: Liquids storage industry, Europe,key statistics, 2022 232
Table 138: Liquids storage industry, Europe, liquids storage capacity by key countries (mcm), 2017–2027 233
Table 139: Liquids storage industry, Europe, crude oil storage capacity by key countries (mcm), 2017–2027 234
Table 140: Liquids storage industry, Europe, petroleum products storage capacity by key countries (mcm), 2017–2027 235
Table 141: Liquids storage industry, Europe, chemicals storage capacity by key countries (mcm), 2017–2027 236
Table 142: Liquids storage industry, Europe, planned and announced liquids storage terminals, 2023–2027 237
Table 143: Europe, annual new build and expansion capital expenditure outlook for liquids storage terminals ($M), 2023–2027 238
Table 144: Liquids storage industry, Europe, annual new build and expansion capital expenditure outlook for liquids storage terminal by key countries ($M), 2023–2027 239
Table 145: Liquids storage industry, Europe, capacity additions through new and existing storage terminals by key countries (mcm), 2023–2027 240
Table 146: Liquids storage industry, Europe, capacity additions through new storage terminals by region (mcm), 2023–2027 241
Table 147: Liquids Storage Industry, Europe, capacity Additions through Expansions of Existing Storage Terminals by Region (mcm), 2023–2027 241
Table 148: Liquids storage industry, Europe, country comparison based on contribution to regional storage capacity (%), 2017–2027 242
Table 149: Liquids storage industry, Netherlands, storage capacity (mcm), 2017–2027 244
Table 150: Liquids storage industry, France, storage capacity (mcm), 2017–2027 247
Table 151: Liquids storage industry, UK, storage capacity (mcm), 2017–2027 252
Table 152: Liquids storage industry, Spain, storage capacity (mcm), 2017–2027 257
Table 153: Liquids storage industry, Germany, storage capacity (mcm), 2017–2027 263
Table 154: Liquids storage industry, Italy, storage capacity (mcm), 2017–2027 269
Table 155: Liquids storage industry, Belgium, storage capacity (mcm), 2017–2027 272
Table 156: Liquids storage industry, Sweden, storage capacity (mcm), 2017–2027 274
Table 157: Liquids storage industry, Finland, storage capacity (mcm), 2017–2027 277
Table 158: Liquids storage industry, Greece, storage capacity (mcm), 2017–2027 279
Table 159: Liquids storage industry, Poland, storage capacity (mcm), 2017–2027 281
Table 160: Liquids storage industry, Denmark, storage capacity (mcm), 2017–2027 282
Table 161: Liquids storage industry, Portugal, storage capacity (mcm), 2017–2027 284
Table 162: Liquids storage industry, Norway, storage capacity (mcm), 2017–2027 285
Table 163: Liquids storage industry, Croatia, storage capacity (mcm), 2017–2027 286
Table 164: Liquids storage industry, Ireland, storage capacity (mcm), 2017–2027 287
Table 165: Liquids storage industry, Romania, storage capacity (mcm), 2017–2027 288
Table 166: Liquids storage industry, Austria, storage capacity (mcm), 2017–2027 290
Table 167: Liquids storage industry, Czech Republic, storage capacity (mcm), 2017–2027 291
Table 168: Liquids storage industry, Switzerland, storage capacity (mcm), 2017–2027 292
Table 169: Liquids storage industry, Slovakia, storage capacity (mcm), 2017–2027 293
Table 170: Liquids storage industry, Serbia, storage capacity (mcm), 2017–2027 293
Table 171: Liquids storage industry, Cyprus, storage capacity (mcm), 2017–2027 294
Table 172: Liquids storage industry, Malta, storage capacity (mcm), 2017–2027 295
Table 173: Liquids storage industry, Albania, storage capacity (mcm), 2017–2027 296
Table 174: Liquids storage industry, Bulgaria, storage capacity (mcm), 2017–2027 297
Table 175: Liquids storage industry, North Macedonia, storage capacity (mcm), 2017–2027 298
Table 176: Liquids storage industry, Iceland, storage capacity (mcm), 2017–2027 298
Table 177: Liquids storage industry, Montenegro, storage capacity (mcm), 2017–2027 299
Table 178: Liquids storage industry, Hungary, storage capacity (mcm), 2017–2027 299
Table 179: Liquids storage industry, Bosnia and Herzegovina, storage capacity (mcm), 2017–2027 300
Table 180: Liquids storage industry, Former Soviet Union, key statistics, 2022 303
Table 181: Liquids storage industry, Former Soviet Union, liquids storage capacity by key countries (mcm), 2017–2027 304
Table 182: Liquids storage industry, Former Soviet Union, crude oil storage capacity by key countries (mcm), 2017–2027 305
Table 183: Liquids storage industry, Former Soviet Union, petroleum products storage capacity by key countries (mcm), 2017–2027 306
Table 184: Liquids storage industry, Former Soviet Union, chemicals storage capacity by key countries (mcm), 2017–2027 307
Table 185: Liquids storage industry, Former Soviet Union, planned and announced liquids storage terminals, 2023–2027 308
Table 186: Former Soviet Union, annual new build and expansion capital expenditure outlook for liquids storage terminals ($M), 2023–2027 309
Table 187: Liquids storage industry, Former Soviet Union, annual new build and expansion capital expenditure outlook for liquids storage terminal by key countries ($M), 2023–2027 310
Table 188: Liquids storage industry, Former Soviet Union, capacity additions through new and existing storage terminals by key countries (mcm), 2023–2027 311
Table 189: Liquids storage industry, Former Soviet Union, capacity additions through new storage terminals by region (mcm), 2023–2027 311
Table 190: Liquids Storage Industry, Former Soviet Union, capacity Additions through Expansions of Existing Storage Terminals by Region (mcm), 2023–2027 312
Table 191: Liquids storage industry, Former Soviet Union, country comparison based on contribution to regional storage capacity (%), 2017–2027 313
Table 192: Liquids storage industry, Russia, storage capacity (mcm), 2017–2027 315
Table 193: Liquids storage industry, Estonia, storage capacity (mcm), 2017–2027 319
Table 194: Liquids storage industry, Latvia, storage capacity (mcm), 2017–2027 320
Table 195: Liquids storage industry, Kazakhstan, storage capacity (mcm), 2017–2027 321
Table 196: Liquids storage industry, Lithuania, storage capacity (mcm), 2017–2027 322
Table 197: Liquids storage industry, Georgia, storage capacity (mcm), 2017–2027 323
Table 198: Liquids storage industry, Azerbaijan, storage capacity (mcm), 2017–2027 324
Table 199: Liquids storage industry, Ukraine, storage capacity (mcm), 2017–2027 325
Table 200: Liquids storage industry, Turkmenistan, storage capacity (mcm), 2017–2027 326
Table 201: Liquids storage industry, Kyrgyzstan, storage capacity (mcm), 2017–2027 326
Table 202: Liquids storage industry, Belarus, storage capacity (mcm), 2017–2027 327
Table 203: Liquids storage industry, Tajikistan, storage capacity (mcm), 2017–2027 328
Table 204: Liquids storage industry, Middle East, key statistics, 2022 331
Table 205: Liquids storage industry, Middle East, liquids storage capacity by key countries (mcm), 2017–2027 332
Table 206: Liquids storage industry, Middle East, crude oil storage capacity by key countries (mcm), 2017–2027 333
Table 207: Liquids storage industry, Middle East, petroleum products storage capacity by key countries (mcm), 2017–2027 334
Table 208: Liquids storage industry, Middle East, chemicals storage capacity by key countries (mcm), 2017–2027 335
Table 209: Liquids storage industry, Middle East, planned and announced liquids storage terminals, 2023–2027 336
Table 210: Middle East, annual new build and expansion capital expenditure outlook for liquids storage terminals ($M), 2023–2027 338
Table 211: Liquids storage industry, Middle East, annual new build and expansion capital expenditure outlook for liquids storage terminal by key countries ($M), 2023–2027 339
Table 212: Liquids storage industry, Middle East, capacity additions through new and existing storage terminals by key countries (mcm), 2023–2027 340
Table 213: Liquids storage industry, Middle East, capacity additions through new storage terminals by region (mcm), 2023–2027 341
Table 214: Liquids Storage Industry, Middle East, capacity Additions through Expansions of Existing Storage Terminals by Region (mcm), 2023–2027 341
Table 215: Liquids storage industry, Middle East, country comparison based on contribution to regional storage capacity (%), 2017–2027 342
Table 216: Liquids storage industry, United Arab Emirates, storage capacity (mcm), 2017–2027 344
Table 217: Liquids storage industry, Saudi Arabia, storage capacity (mcm), 2017–2027 348
Table 218: Liquids storage industry, Iran, storage capacity (mcm), 2017–2027 350
Table 219: Liquids storage industry, Turkey, storage capacity (mcm), 2017–2027 354
Table 220: Liquids storage industry, Kuwait, storage capacity (mcm), 2017–2027 357
Table 221: Liquids storage industry, Israel, storage capacity (mcm), 2017–2027 358
Table 222: Liquids storage industry, Iraq, storage capacity (mcm), 2017–2027 359
Table 223: Liquids storage industry, Oman, storage capacity (mcm), 2017–2027 361
Table 224: Liquids storage industry, Bahrain, storage capacity (mcm), 2017–2027 363
Table 225: Liquids storage industry, Lebanon, storage capacity (mcm), 2017–2027 364
Table 226: Liquids storage industry, Qatar, storage capacity (mcm), 2017–2027 365
Table 227: Liquids storage industry, Yemen, storage capacity (mcm), 2017–2027 366
Table 228: Liquids storage industry, Jordan, storage capacity (mcm), 2017–2027 367
Table 229: Liquids storage industry, Syria, storage capacity (mcm), 2017–2027 368
Table 230: Liquids storage industry, North America, key statistics, 2022 372
Table 231: Liquids storage industry, North America, liquids storage capacity by countries (mcm), 2017–2027 373
Table 232: Liquids storage industry, North America, crude oil storage capacity by countries (mcm), 2017–2027 374
Table 233: Liquids storage industry, North America, petroleum products storage capacity by countries (mcm), 2017–2027 375
Table 234: Liquids storage industry, North America, chemicals storage capacity by countries (mcm), 2017–2027 376
Table 235: Liquids storage industry, North America, planned and announced liquids storage terminals, 2023–2027 377
Table 236: North America, annual new build and expansion capital expenditure outlook for liquids storage terminals ($M), 2023–2027 379
Table 237: Liquids storage industry, North America, annual new build and expansion capital expenditure outlook for liquids storage terminal by country ($M), 2023–2027 380
Table 238: Liquids storage industry, North America, capacity additions through new and existing storage terminals by key countries (mcm), 2023–2027 381
Table 239: Liquids storage industry, North America, capacity additions through new storage terminals by region (mcm), 2023–2027 382
Table 240: Liquids Storage Industry, North America, capacity Additions through Expansions of Existing Storage Terminals by Region (mcm), 2023–2027 382
Table 241: Liquids storage industry, North America, country comparison based on contribution to regional storage capacity (%), 2017–2027 383
Table 242: Liquids storage industry, US, storage capacity (mcm), 2017–2027 385
Table 243: Liquids storage industry, Canada, storage capacity (mcm), 2017–2027 485
Table 244: Liquids storage industry, Mexico, storage capacity (mcm), 2017–2027 490
Table 245: Liquids storage industry, Oceania, key statistics, 2022 497
Table 246: Liquids storage industry, Oceania, liquids storage capacity by key countries (mcm), 2017–2027 498
Table 247: Liquids storage industry, Oceania, crude oil storage capacity by key countries (mcm), 2017–2027 499
Table 248: Liquids storage industry, Oceania, petroleum products storage capacity by key countries (mcm), 2017–2027 500
Table 249: Liquids storage industry, Oceania, chemicals storage capacity by key countries (mcm), 2017–2027 501
Table 250: Liquids storage industry, Oceania, planned and announced liquids storage terminals, 2023–2027 502
Table 251: Oceania, annual new build and expansion capital expenditure outlook for liquids storage terminals ($M), 2023–2027 503
Table 252: Liquids storage industry, Oceania, annual new build and expansion capital expenditure outlook for liquids storage terminal by country ($M), 2023–2027 504
Table 253: Liquids storage industry, Oceania, capacity additions through new and existing storage terminals by key countries (mcm), 2023–2027 505
Table 254: Liquids storage industry, Oceania, capacity additions through new storage terminals by region (mcm), 2023–2027 505
Table 255: Liquids Storage Industry, Oceania, capacity Additions through Expansions of Existing Storage Terminals by Region (mcm), 2023–2027 505
Table 256: Liquids storage industry, Oceania, country comparison based on contribution to regional storage capacity (%), 2017–2027 506
Table 257: Liquids storage industry, Australia, storage capacity (mcm), 2017–2027 508
Table 258: Liquids storage industry, New Zealand, storage capacity (mcm), 2017–2027 513
Table 259: Liquids storage industry, Papua New Guinea, storage capacity (mcm), 2017–2027 514
Table 260: Liquids storage industry, Samoa, storage capacity (mcm), 2017–2027 514
Table 261: Liquids storage industry, South America, key statistics, 2022 516
Table 262: Liquids storage industry, South America, liquids storage capacity by key countries (mcm), 2017–2027 517
Table 263: Liquids storage industry, South America, crude oil storage capacity by key countries (mcm), 2017–2027 518
Table 264: Liquids storage industry, South America, petroleum products storage capacity by key countries (mcm), 2017–2027 519
Table 265: Liquids storage industry, South America, chemicals storage capacity by key countries (mcm), 2017–2027 520
Table 266: Liquids storage industry, South America, planned and announced liquids storage terminals, 2023–2027 521
Table 267: South America, annual new build and expansion capital expenditure outlook for liquids storage terminals ($M), 2023–2027 522
Table 268: Liquids storage industry, South America, annual new build and expansion capital expenditure outlook for liquids storage terminal by key countries ($M), 2023–2027 523
Table 269: Liquids storage industry, South America, capacity additions through new and existing storage terminals by key countries (mcm), 2023–2027 524
Table 270: Liquids storage industry, South America, capacity additions through new storage terminals by region (mcm), 2023–2027 525
Table 271: Liquids Storage Industry, South America, capacity Additions through Expansions of Existing Storage Terminals by Region (mcm), 2023–2027 525
Table 272: Liquids storage industry, South America, country comparison based on contribution to regional storage capacity (%), 2017–2027 526
Table 273: Liquids storage industry, Brazil, storage capacity (mcm), 2017–2027 528
Table 274: Liquids storage industry, Venezuela, storage capacity (mcm), 2017–2027 536
Table 275: Liquids storage industry, Colombia, storage capacity (mcm), 2017–2027 537
Table 276: Liquids storage industry, Peru, storage capacity (mcm), 2017–2027 539
Table 277: Liquids storage industry, Argentina, storage capacity (mcm), 2017–2027 542
Table 278: Liquids storage industry, Ecuador, storage capacity (mcm), 2017–2027 544
Table 279: Liquids storage industry, Chile, storage capacity (mcm), 2017–2027 546
Table 280: Liquids storage industry, Uruguay, storage capacity (mcm), 2017–2027 548
Table 281: Liquids storage industry, Paraguay, storage capacity (mcm), 2017–2027 549
Table 282: Liquids storage industry, Bolivia, storage capacity (mcm), 2017–2027 550