South Africa Confectionery Market Size and Trend Analysis by Categories and Segment, Distribution Channel, Packaging Formats, Market Share, Demographics and Forecast, 2021-2026
Powered by ![]()
All the vital news, analysis, and commentary curated by our industry experts.

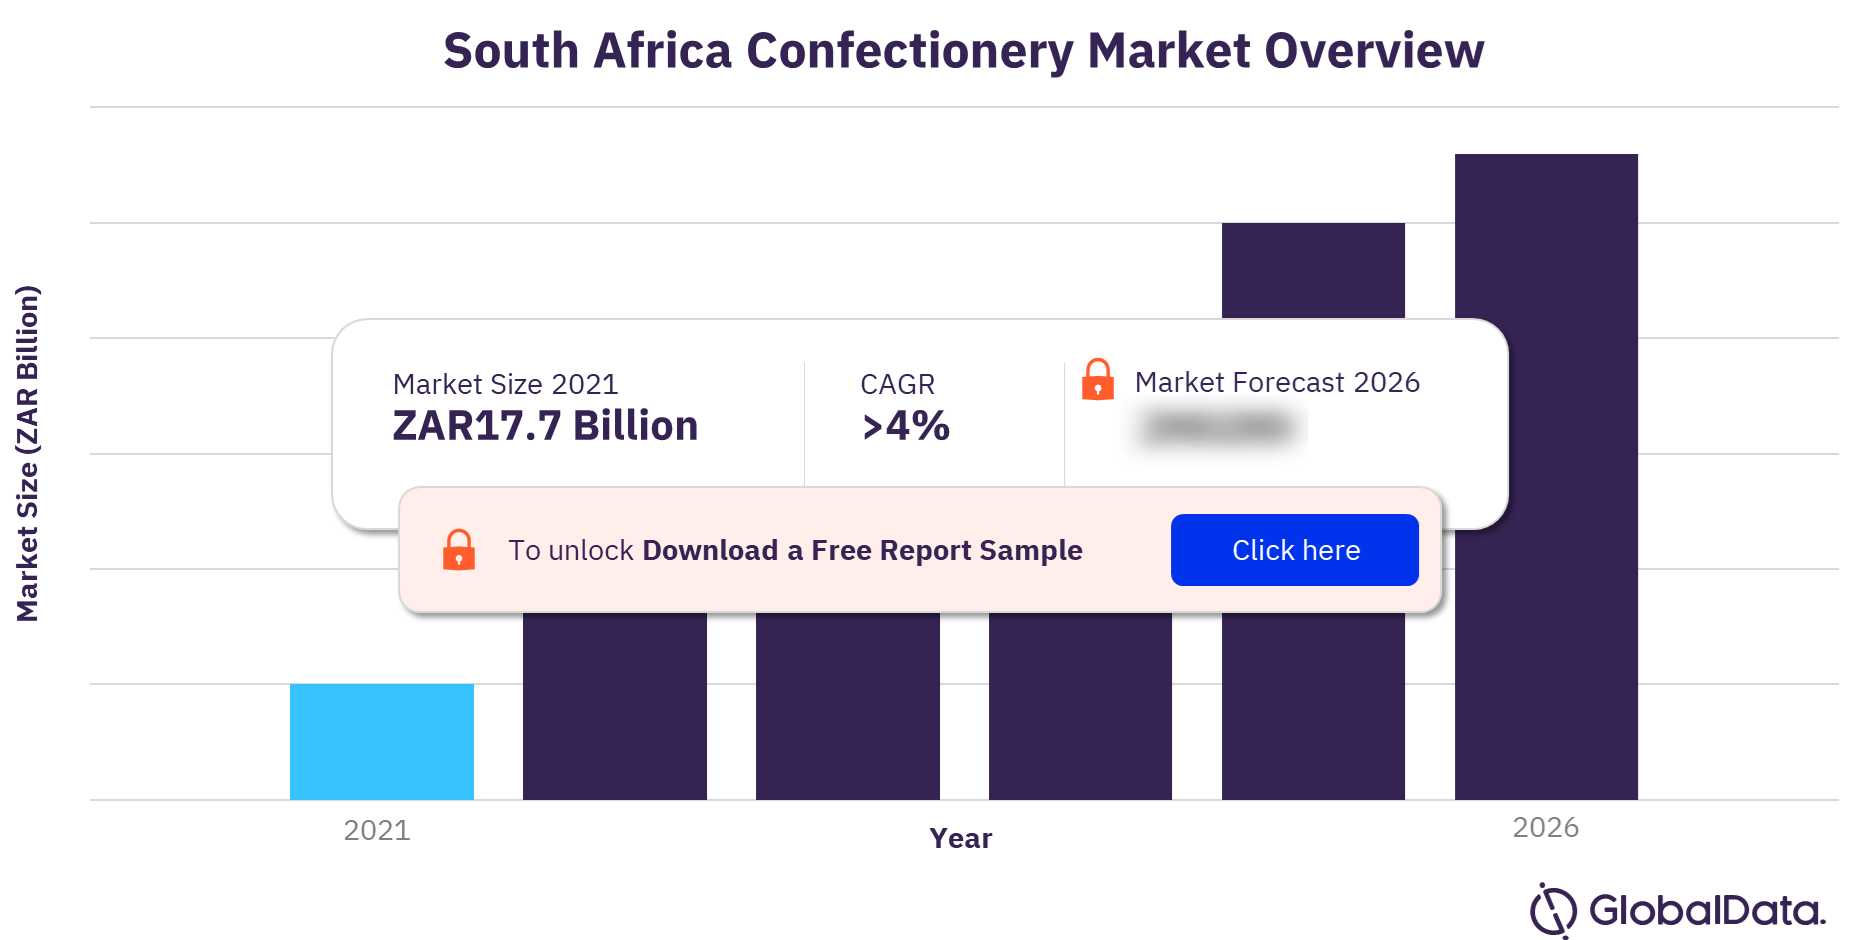
South Africa Confectionery Market Overview
The South Africa confectionery market size was valued at ZAR17.7 billion ($1.20 billion) in 2021. The market is expected to achieve a CAGR of more than 4% during 2021-2026. The South African confectionery market was led by sugar confectionery in value terms, in 2021. Hypermarkets & supermarkets accounted for the leading share in the distribution of confectionery products while flexible packaging was the most used pack material for confectionery in the country. Johannesburg emerged as the largest confectionery market in South Africa, followed by Cape Town and Durban.
The South Africa confectionery market research report provides insights on high-growth markets to target, trends in the usage of packaging materials, types and closures category level distribution data, and company market shares.
For more insights on the South Africa confectionery market forecast, download a free report sample
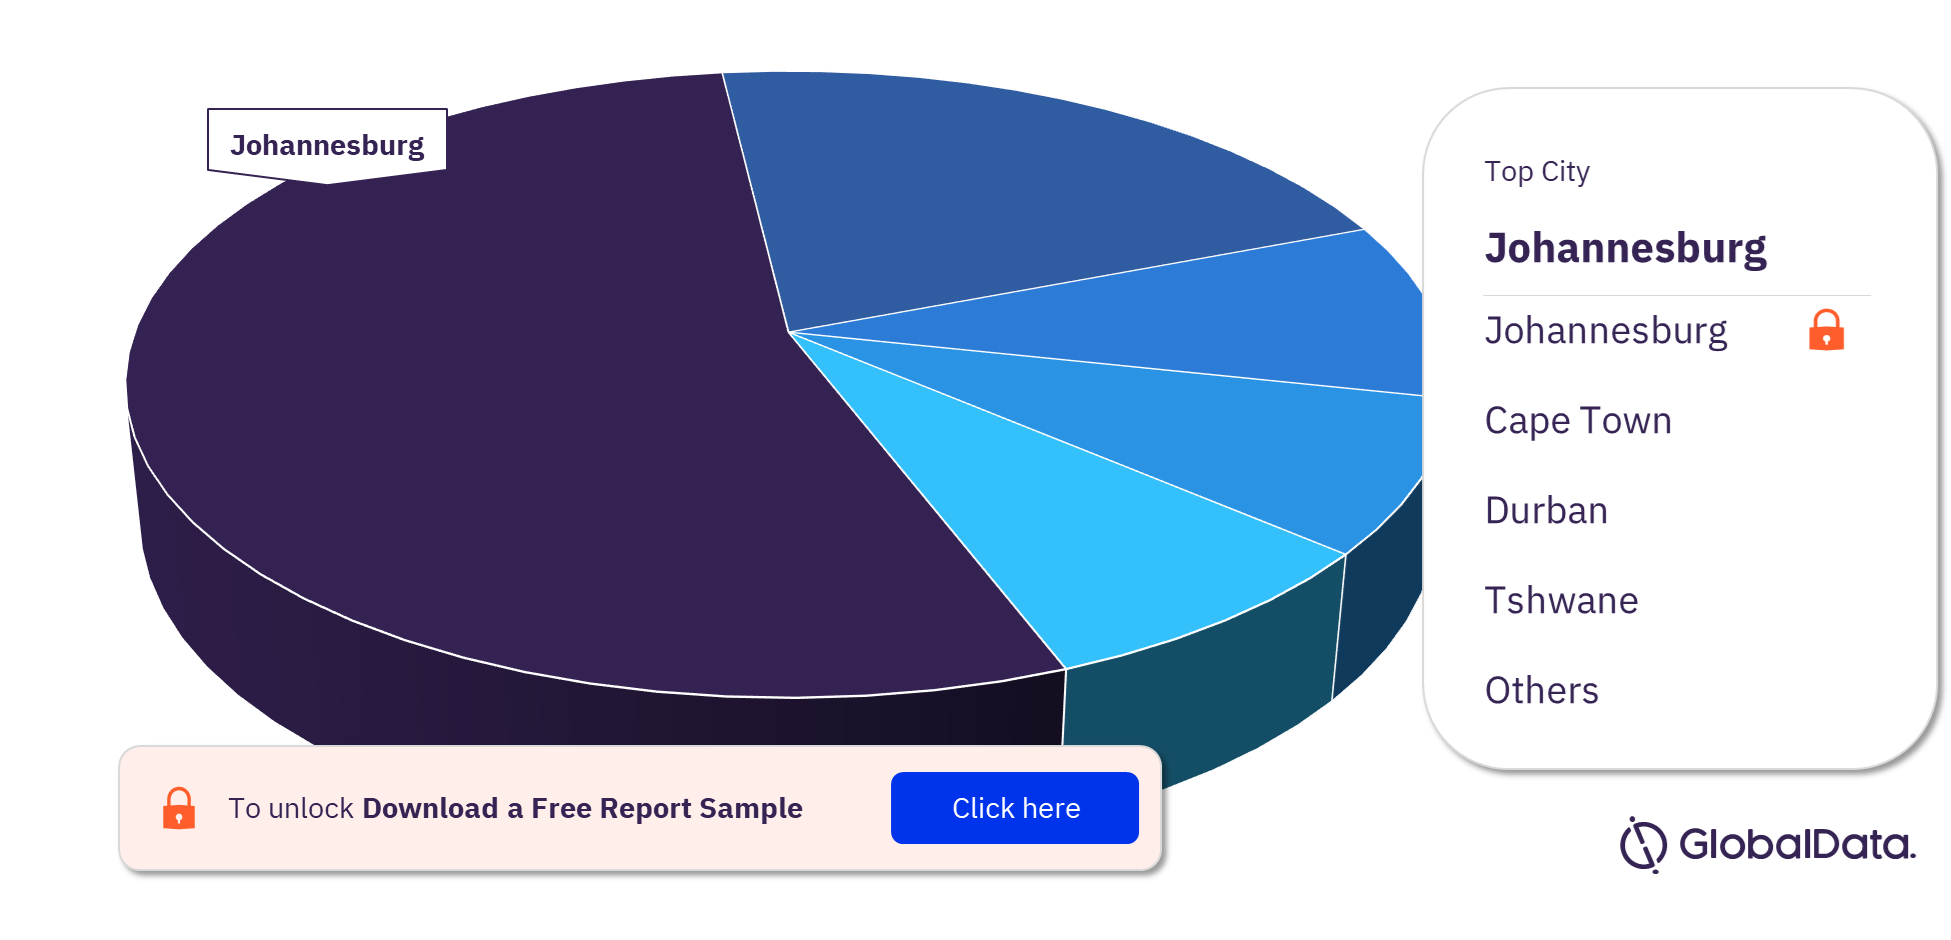
South Africa Confectionery Market Segmentation by Top Cities
The top cities in the South Africa confectionery market are Johannesburg, Cape Town, Durban, Tshwane, Ekurhuleni, Nelson Mandela Bay, Buffalo City, and Mangaung. Johannesburg accounted for the largest confectionery market share in South Africa in 2021.
South Africa Confectionery Market Analysis, by Top Cities
To know more about the top cities in the South Africa confectionery market, download a free report sample
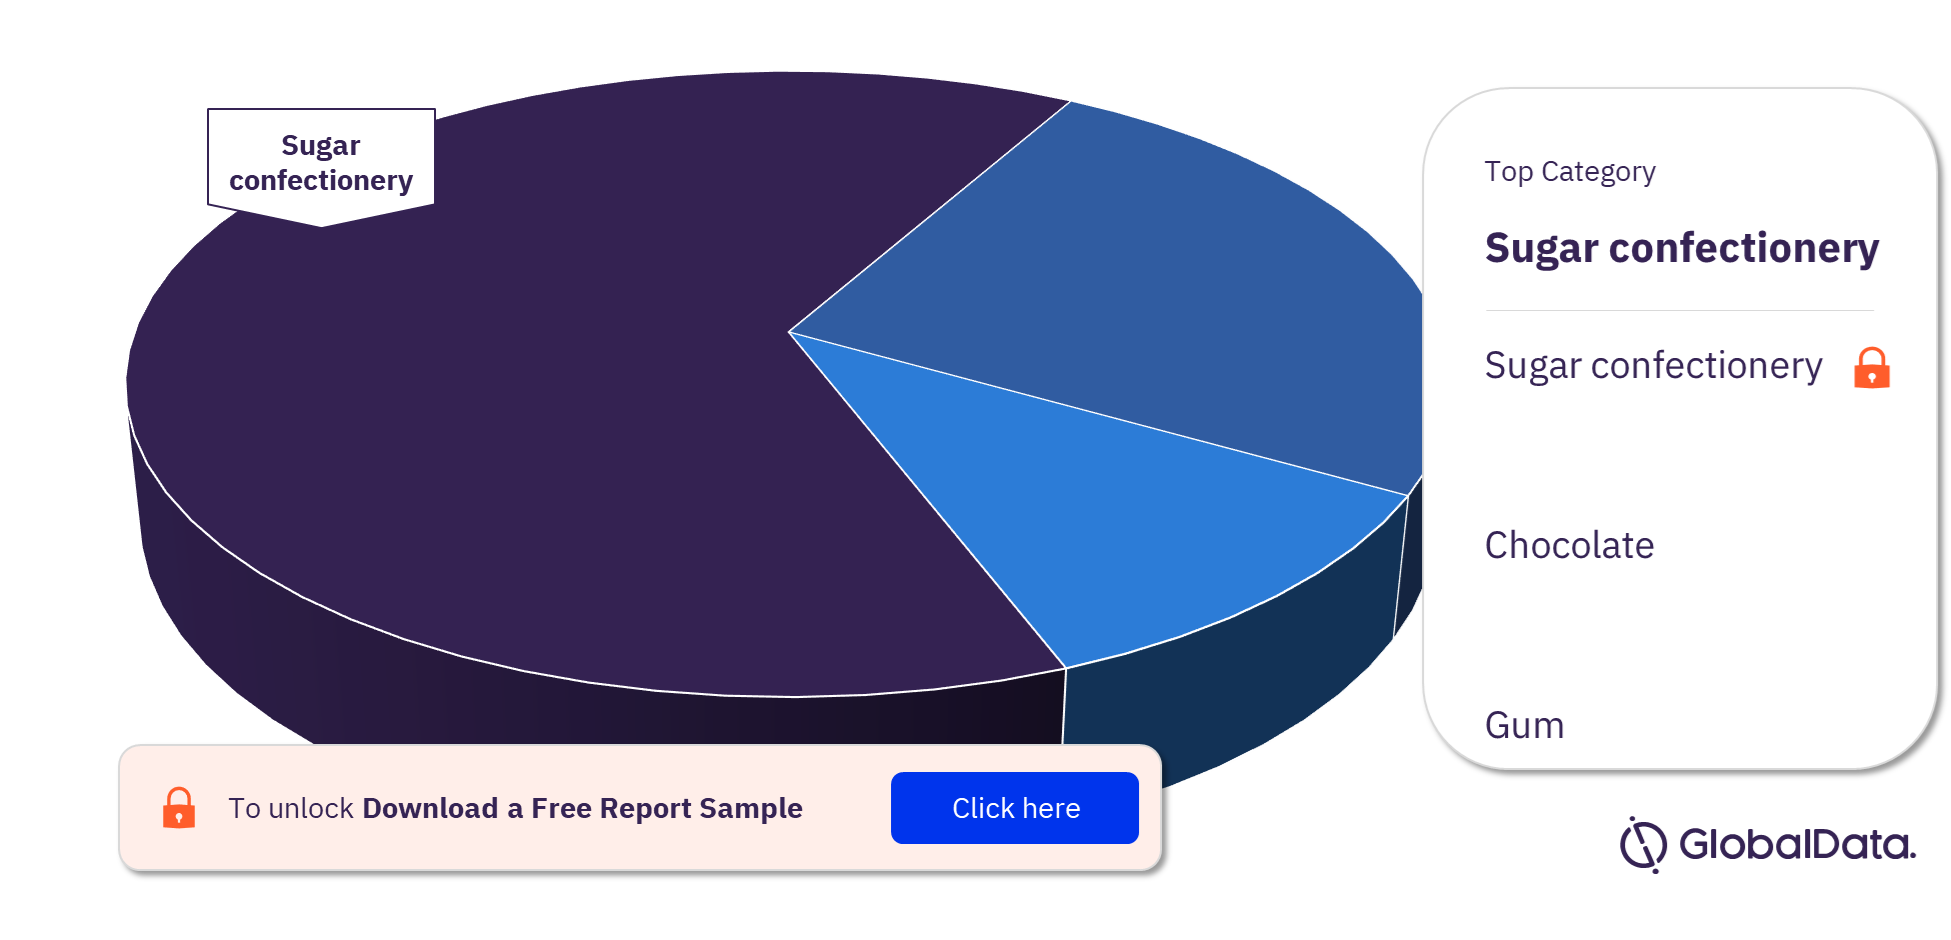
South Africa Confectionery Market Segmentation by Category
The key categories in the South Africa confectionery market are chocolate, gum, and sugar confectionery. The sugar confectionery category is forecast to register the fastest value growth during 2021-2026.
South Africa Confectionery Market Analysis, by Categories
For more category insights in the South Africa confectionery market, download a free report sample
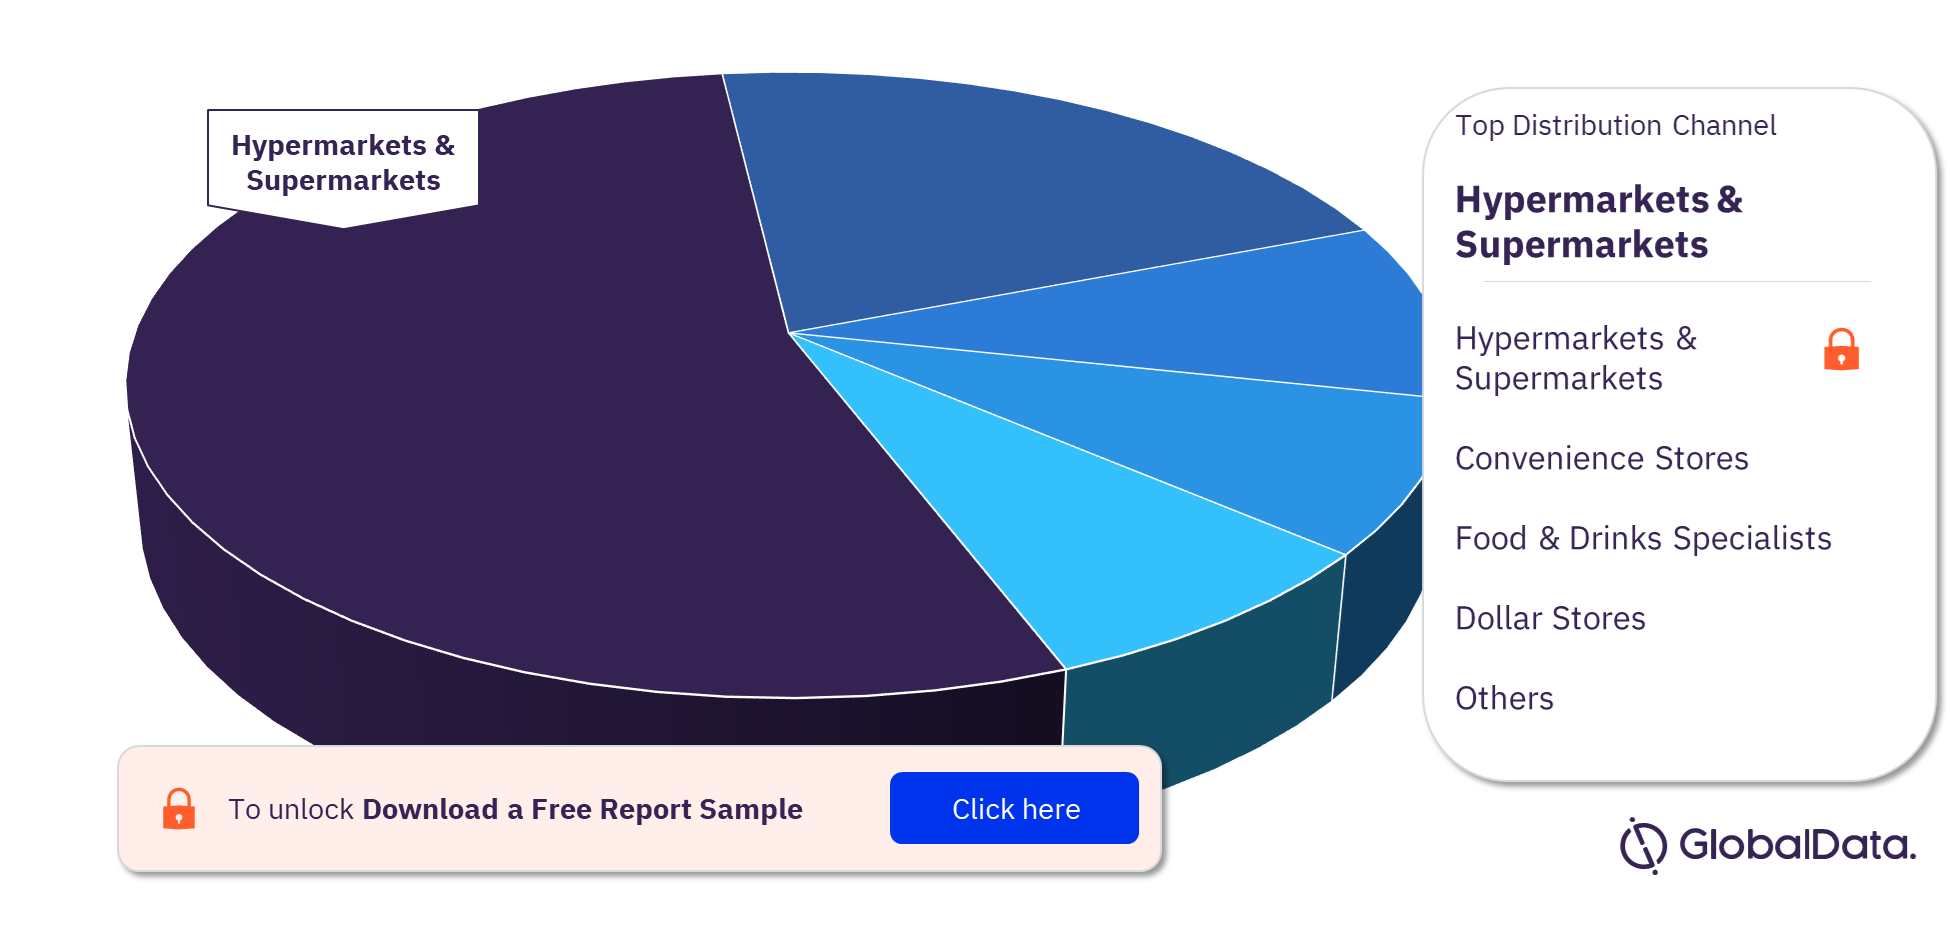
South Africa Confectionery Market Segmentation by Distribution Channel
The key distribution channels in the South Africa confectionery market are hypermarkets and supermarkets, convenience stores, food and drinks specialists, dollar stores, and cash and carries and warehouse clubs. Hypermarkets & supermarkets was the leading distribution channel in the South African confectionery sector in 2021, followed by convenience stores and food and drinks specialists.
South Africa Confectionery Market Analysis, by Distribution Channel
For more distribution channel insights in the South Africa confectionery market, download a free report sample
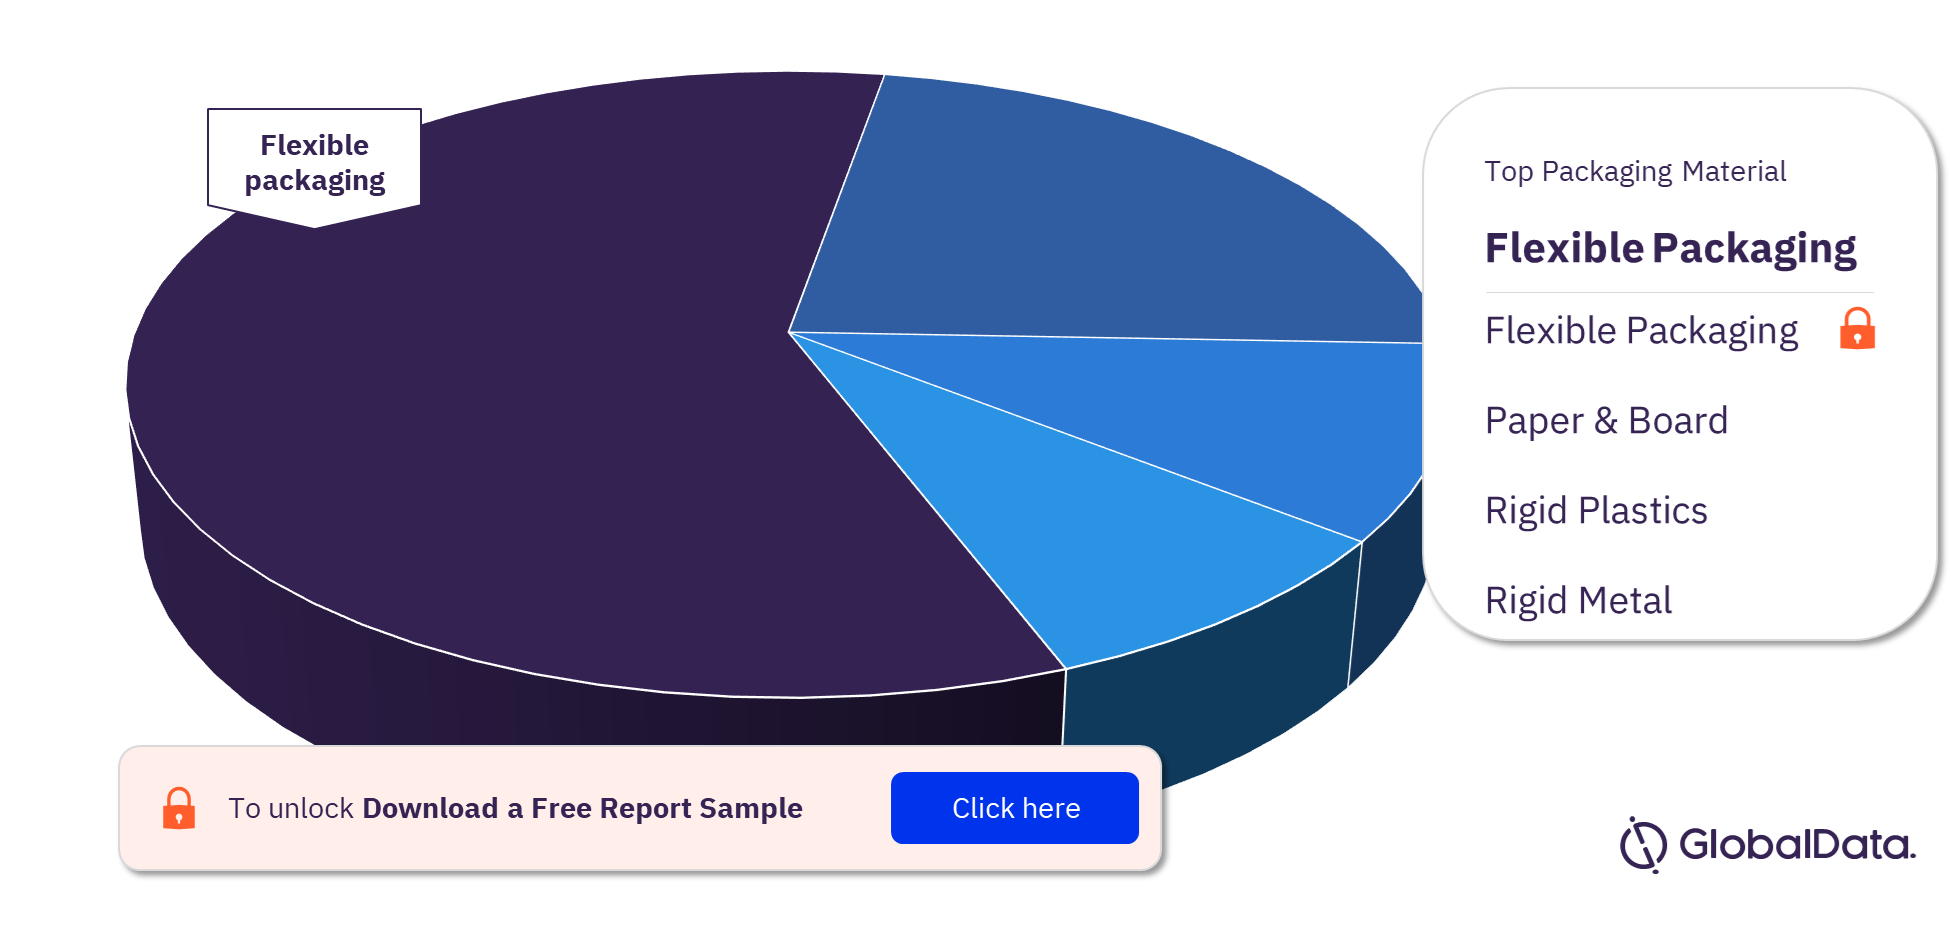
South Africa Confectionery Market Segmentation by Packaging Material
The key packaging materials in the South Africa confectionery market are flexible packaging, paper and board, rigid plastics, and rigid metal. Flexible packaging was the most used pack material in the South Africa confectionery sector, followed by paper & board and rigid plastics.
South Africa Confectionery Market Analysis, by Packaging Material
For more packaging material insights in the South Africa confectionery market, download a free report sample
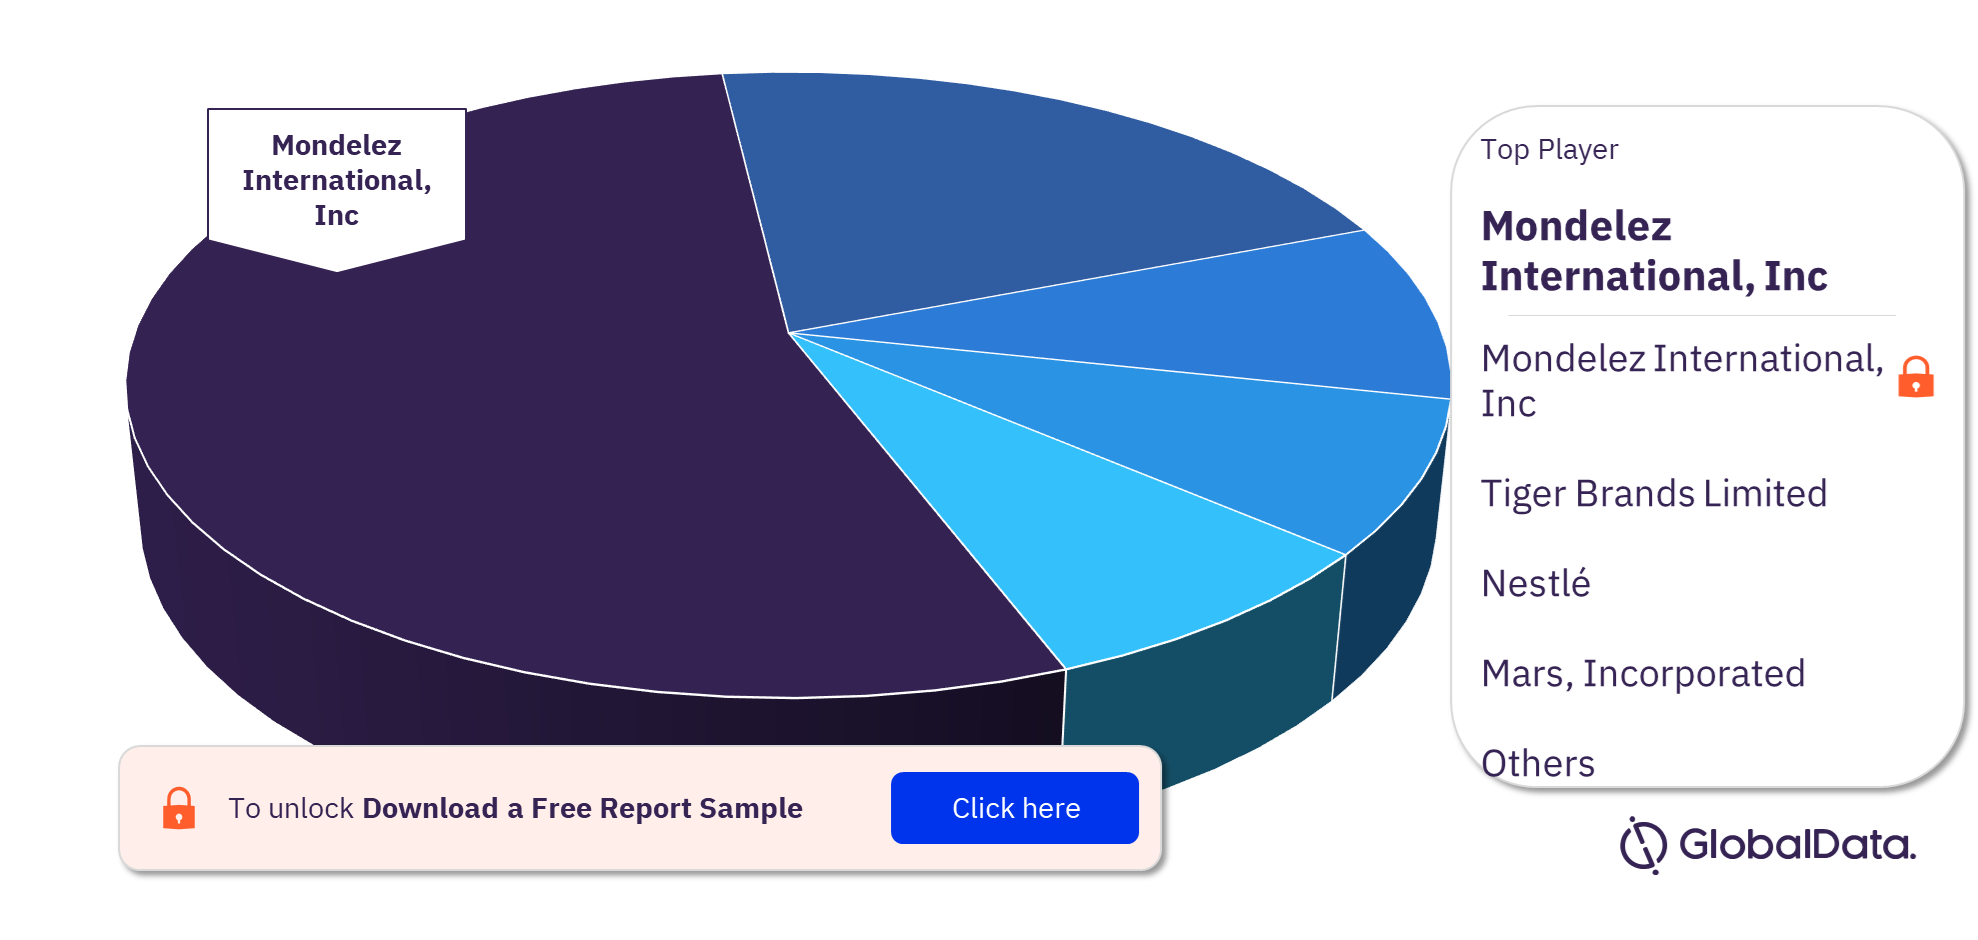
Competitive Landscape
Some of the leading players in the South Africa confectionery market are Mondelez International, Inc, Tiger Brands Limited, Nestlé, Mars, Incorporated, and Lode Stone. Mondelez International, Inc accounted for the largest South Africa confectionery market share by value in 2021.
South Africa Confectionery Market Analysis, by Leading Players
To know more about leading confectionery players in South Africa, download a free report sample
South Africa Confectionery Market Overview
| Market Size 2021 | ZAR17.7 billion ($1.20 billion) |
| CAGR (2021-2026) | >4% |
| Key Cities | Johannesburg, Cape Town, Durban, Tshwane, Ekurhuleni, Nelson Mandela Bay, Buffalo City, and Mangaung |
| Key Categories | Chocolate, Sugar Confectionery, and Gum |
| Key Distribution Channels | Hypermarkets and Supermarkets, Convenience Stores, Food and Drinks Specialists, Dollar Stores, and Cash and Carries and Warehouse Clubs |
| Key Packaging Materials | Flexible Packaging, Paper and Board, Rigid Plastics, and Rigid Metal |
| Key Players | Mondelez International, Inc, Tiger Brands Limited, Nestlé, Mars, Incorporated, and Lode Stone |
Scope
This report provides:
- Overall sector value and volume data with growth analysis.
- Value and growth analysis for chocolate, gum, and sugar confectionery with inputs on individual segment share within each category and the change in their market share forecast.
- Market share of companies and private labels in 2021.
- Percentage of sales within each category through distribution channels.
- Consumption breakdown for package materials and pack types in each category in terms of percentage share of the number of units sold, pack material data, pack type, closure type, and primary outer type.
Key Highlights
- Per capita consumption of confectionery was higher in South Africa than at the regional level in 2021.
- The per capita consumption of sugar confectionery was higher than other confectionery categories in South Africa in 2021.
- Hypermarkets & supermarkets is the leading distribution channel in the South African confectionery sector.
- Flexible packaging accounted for a major share of the South African confectionery sector in 2021.
- “Kids & babies” represent the largest subset of the confectionery sector in South Africa.
Reasons to Buy
- Identify high-potential categories and explore further market opportunities based on detailed value and volume analysis.
- Existing and new players can analyze key distribution channels to identify and evaluate trends and opportunities.
- Gain an understanding of the total competitive landscape based on detailed company share analysis to plan effective market positioning.
- Our team of analysts have placed a significant emphasis on changes expected in the market that will provide a clear picture of the opportunities that can be tapped over the next five years, resulting in revenue expansion.
- The packaging analysis report helps manufacturers in identifying the most commonly used packaging materials in the sector.
- Analysis of key macroeconomic indicators such as real GDP, nominal GDP, consumer price index, household consumption expenditure, population (by age group, gender, rural-urban split, and employed people, and unemployment rate). It also includes an economic summary of the country along with the labor market and demographic trends.
Mondelez International Inc
Lode Stone
Nestlé
Mars Incorporated
Trolli GmbH
Premier Foods PLC
Delite Foods (Pty) Ltd)
Joya Brands (Pty) Ltd
Table of Contents
Table
Figures
Frequently asked questions
-
What was the South Africa confectionery market size in 2021?
The confectionery market size in South Africa was valued at ZAR17.7 billion ($1.20 billion) in 2021.
-
What is the South Africa confectionery market growth rate?
The confectionery market in South Africa is expected to achieve a CAGR of more than 4% during 2021-2026.
-
Which are the key cities in the South Africa confectionery market?
The key cities in the South African confectionery market are Johannesburg, Cape Town, Durban, Tshwane, Ekurhuleni, Nelson Mandela Bay, Buffalo City, and Mangaung.
-
What are the key categories of the South Africa confectionery market?
The key categories in the South Africa confectionery market are chocolate, gum, and sugar confectionery.
-
What are the key distribution channels of the South Africa confectionery market?
The key distribution channels in the South African confectionery market are hypermarkets and supermarkets, convenience stores, food and drinks specialists, dollar stores, and cash and carries and warehouse clubs.
-
What are the key packaging materials used in the South Africa confectionery market?
The key packaging materials used in the South Africa confectionery market are flexible packaging, paper and board, rigid plastics, and rigid metal.
-
Who are the leading players in the South Africa confectionery market?
Some of the leading players in the South Africa confectionery market are Mondelez International, Inc, Tiger Brands Limited, Nestlé, Mars, Incorporated, and Lode Stone.
Get in touch to find out about multi-purchase discounts
reportstore@globaldata.com
Tel +44 20 7947 2745
Every customer’s requirement is unique. With over 220,000 construction projects tracked, we can create a tailored dataset for you based on the types of projects you are looking for. Please get in touch with your specific requirements and we can send you a quote.
Sample Report
South Africa Confectionery Market Size and Trend Analysis by Categories and Segment, Distribution Channel, Packaging Formats, Market Share, Demographics and Forecast, 2021-2026 was curated by the best experts in the industry and we are confident about its unique quality. However, we want you to make the most beneficial decision for your business, so we offer free sample pages to help you:
- Assess the relevance of the report
- Evaluate the quality of the report
- Justify the cost
Download your copy of the sample report and make an informed decision about whether the full report will provide you with the insights and information you need.